


Respondents answered questions about their awareness of human rights, attitudes towards various groups in Ontario, and their personal experience with discrimination. Appendix A outlines the survey methodology.
The questions and responses are summarized and organized to reflect the four focus areas in the OHRC’s Strategic Plan (Indigenous reconciliation, the criminal justice system, poverty and education). Endnotes show the cross-tabulation data tables, with links to the full survey data file on the OHRC’s website. Appendix B includes the complete survey questionnaire.
Human rights awareness
Is discrimination, including harassment, a problem in Ontario?[1]
Two-thirds (66%) of respondents to the survey think discrimination is at least somewhat of a problem in Ontario. Very few (4%) think it is not a problem at all. Responses were similar for people across the province, and among many population subgroups.
Overall, 12% of respondents think that discrimination and harassment is a major problem. Thinking it is a major problem is higher among people from the following respondent groups:
- Age 45 to 59 (17%)
- City of Toronto (17%) and Northern Ontario (18%)
- Household incomes under $40,000 (17%)
- Unemployed and/or receiving disability assistance (17%)
- Respondents who indicate they personally experienced discrimination in the past five years (17%).
Across different groups, a higher percentage of Black respondents think that discrimination is a major problem (32%), followed by Indigenous respondents (24%), respondents who identify as LGBTQ[2] (23%), respondents with disabilities (17%) and respondents of non-European origins (16%).
| A major problem |
Somewhat |
Not much of a problem |
Not a problem at all | |
|---|---|---|---|---|
| Total | 12% | 54% | 30% | 4% |
| British/European | 10% | 55% | 30% | 4% |
| Black | 32% | 54% | 14% | 0% |
| Indigenous | 24% | 48% | 25% | 4% |
| All non-European | 16% | 53% | 28% | 3% |
What do you think are the most common reasons for discrimination?[3]
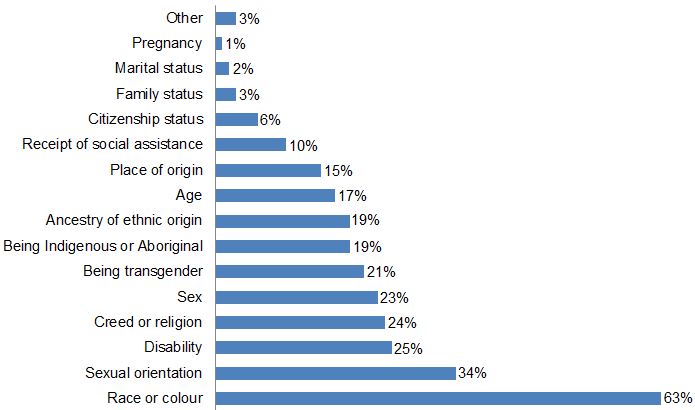
When asked to pick the three most common reasons for discrimination or harassment, a majority of respondents (63%) picked race or colour as the most common reason. This is much higher than the next most mentioned reason, sexual orientation (34%).
Graph 1: Most common reasons for discrimination or harassment in Ontario
Higher percentages of the following respondent groups also listed race and colour as a main reason:Race or colour was the top reason across Ontario and in almost all population subgroups. This response was higher among respondents in the 905-area (72%) and the City of Toronto (70%), than other regions (46% to 58%), and was also highest for respondents with a bachelor’s degree (70%).
- South Asian (91%)
- Chinese and South East Asian (78%)
- Black (77%)
- Identifying as from a racialized group (75%)
- Born outside of Canada (72%).
While 19% of all respondents chose being Indigenous as one of the most common reasons for discrimination in Ontario, 44% of respondents living in Northern Ontario hold this view.
A higher proportion (40%) of younger respondents (age 18 to 29), respondents identifying as LGBTQ (57%), and respondents living in Northern Ontario (44%) think sexual orientation is a main reason people experience discrimination in Ontario.
A higher proportion of women (25% vs. 16% of men), younger respondents (26% aged 18 – 29), LGBTQ respondents (30%) and people with disabilities (28%) listed being transgender as a main reason for discrimination.
A higher percentage of respondents living with a disability (40%) listed disability as a reason for discrimination, compared to all respondents (25%). Creed or religion were cited more often by Muslim (64%), Jewish (32%) and non-Christian respondents (37%), compared to 24% of Christian respondents.
How well are human rights protected in Ontario?[4]
Six out of ten (61%) respondents think that human rights are somewhat well protected, while only one in seven (15%) think they are very well protected.
A minority (25%) of respondents think that human rights are not very well or at all protected. The percentages are higher among women versus men respondents (28% vs. 22%), respondents who are unemployed and/or receiving disability assistance (34%) and respondents who have experienced discrimination in the past five years (35%).
| Very well protected | Somewhat well protected | Not very well protected | Not protected at all |
|
|---|---|---|---|---|
| Total | 15% | 61% | 23% | 2% |
| Experienced discrimination, last 5 years (N=725) | 12% | 57% | 27% | 3% |
| Experienced discrimination, not in last 5 years (N=353) | 15% | 64% | 21% | 0% |
| Never experienced discrimination (N=423) | 18% | 64% | 17% | 1% |
Are you familiar with Ontario’s human rights system?
Two-thirds (66%) of respondents believe they know something about human rights protections and obligations.[5] Smaller numbers, however, say they have at least some familiarity with Ontario’s human rights laws and system:[6]
- Human Rights Code – 55%
- Ontario Human Rights Commission (OHRC) – 48%
- Human Rights Tribunal of Ontario (HRTO) – 36%
- Human Rights Legal Support Centre (HRLSC) – 25%.
Familiarity with Ontario’s human rights system is similar across the province and many subgroups, with some exceptions:
- Awareness of the Code, the OHRC and the HRTO is linked to higher levels of education and household income
- Respondents who have personally experienced discrimination in the past five years, or who report being very informed about human rights protections and obligations, report higher levels of being at least somewhat familiar with the Code and the three agencies
- Respondents who feel discrimination is a major problem in the province are more likely than others to be aware of the Code, the HRTO and the HRLSC
- Black respondents are more likely to be aware of the Code and the three agencies than respondents overall, whereas British/European, Chinese/South East Asian or Latin American respondents are less likely to have awareness about human rights laws and agencies.
| Total | Indigenous | British/ European |
Chinese/ South East Asian |
South Asian | Black | Latin American | Arab/ West Asian |
All non-European | |
|---|---|---|---|---|---|---|---|---|---|
| Base – n= | 1501 | 59 | 1162 | 161 | 63 | 59 | 21 | 20 | 327 |
| Ontario Human Rights Code | 55% | 67% | 55% | 47% | 62% | 65% | 40% | 56% | 53% |
| Ontario Human Rights Commission | 48% | 53% | 48% | 35% | 57% | 65% | 31% | 53% | 46% |
| Human Rights Tribunal of Ontario | 36% | 44% | 36% | 29% | 40% | 57% | 12% | 38% | 37% |
| Human Rights Legal Support Centre | 25% | 47% | 24% | 23% | 42% | 40% | 19% | 34% | 31% |
| None of the above | 33% | 19% | 33% | 43% | 23% | 21% | 46% | 29% | 34% |
A minority of respondents (one in five) agree that discrimination is no longer a major issue, so we don’t need an OHRC, HRLSC and HRTO.[7]
A strong majority of respondents in all subgroups agree that students should learn more about human rights and responsibilities in school (45% strongly agree, 89% agree overall).[8]
Attitudes about groups and accommodations[9]
How accepting would you say Ontarians generally are towards people from a variety of cultural backgrounds?[10]
A majority (56%) of respondents feel people in Ontario are generally “as accepting as they should be” towards people from a variety of cultural backgrounds, including immigrants from other countries. Three in ten think people are not tolerant enough, and one in seven (14%) think there is too much tolerance.
How often do you personally have any contact or interact with certain groups of people?[11]
Respondents are most likely to often encounter people of different ethnic origins or religions or racialized groups, and least likely to have contact with refugees or transgender people:
- Over half of respondents have contact with most groups at least sometimes, except with refugees (39%) and transgender people (34%)
- Over half say they have frequent contact with people whose ethnic origin is different than theirs, and roughly half often have contact with people with a different creed or religion, or from a racialized group
- Fewer than one in 10 report frequent contact with refugees or people who identify as transgender.
| Frequently | Sometimes | Rarely | Never | |
|---|---|---|---|---|
| People with a different ethnic origin than yours |
54% | 36% | 9% | 1% |
| People with a different creed or religion than yours |
52% | 37% | 9% | 2% |
| People of colour/visible minorities | 49% | 38% | 12% | 2% |
| Asian people | 41% | 42% | 15% | 2% |
| Black, African or Afro Caribbean people |
38% | 44% | 16% | 2% |
| Immigrants | 37% | 41% | 19% | 4% |
| Lesbian, gay, or bisexual people |
29% | 42% | 24% | 4% |
| Muslim people | 27% | 40% | 26% | 7% |
| Physical or intellectual, cognitive or learning disabilities |
25% | 46% | 26% | 3% |
| People with mental health disabilities or addictions |
25% | 40% | 30% | 4% |
| Arab people | 21% | 41% | 31% | 7% |
| People on social assistance | 20% | 41% | 32% | 7% |
| Indigenous or Aboriginal people | 17% | 38% | 36% | 8% |
| Refugees | 9% | 30% | 46% | 15% |
| Transgender people | 8% | 26% | 45% | 21% |
Frequency of contact with specific groups is linked to a range of factors, including geographic location, social and economic status, and ethnicity.
Having at least some contact with most groups is higher for respondents who live in the City of Toronto and the 905-area. Respondents in northern Ontario report higher contact with people who identify as lesbian, gay or bisexual (81% vs. 71% overall); people with physical, intellectual, cognitive or learning disabilities (84% vs. 71%); and Indigenous peoples (83% vs. 56%).
In general, respondents’ contact with most groups is fairly similar by gender with some exceptions:
- Women are more likely than men to report contact with people who identify as lesbian, gay or bisexual (76% vs. 65%), people with physical, intellectual, cognitive or learning disabilities (73% vs. 68%) or mental health disabilities (70% vs. 61%), and people receiving social assistance (64% vs. 58%)
- Men are more likely than women to report contact with Asian people (87% vs. 80%) and immigrants (80% vs. 75%).
Being in the workplace or school can also increase opportunities for respondent groups to have contact with people from diverse backgrounds:
- People with a college or higher education are generally more likely to report contact with diverse people at higher rates than people with a high school education or less
- However, persons with lower levels of education are more likely to report contact with people with mental health disabilities or addictions, Indigenous peoples, and people receiving social assistance
- Students are among the most likely to have contact at least sometimes with many ethnic groups, racialized groups, people with different religions, and people who are lesbian, gay, bisexual or transgender
- People aged 60 and over, and people who are not currently in the workforce or retired are generally less likely to report contact with various groups.
How positive or negative are you towards specific groups in our society?[12]
Majorities of respondents are at least somewhat positive about 10 of the 15 groups identified in the survey,[13] with the highest levels of positive feelings for people with physical or cognitive disabilities (64% very or somewhat positive), Asian people (62% positive), people of different ethnic origins (62%), and racialized groups (61%).
Fewer than half of the respondents are positive about the five other groups: transgender people (46%), refugees (46%), Muslim (45%) or Arab people (44%), and people receiving social assistance (39%).
Respondents who are not positive are most likely to say they are neutral. Around one in five each expresses negative feelings toward Muslims, people receiving social assistance, refugees and Arab people.
| Very positive | Somewhat positive | Neutral | Somewhat negative | Very negative | |
|---|---|---|---|---|---|
| People with physical /intellectual/ cognitive /learning disabilities |
37% | 27% | 31% | 3% | 1% |
| People of colour / racialized groups | 34% | 27% | 34% | 4% | 1% |
| People with a different ethnic origin than yours | 33% | 29% | 35% | 3% | 0% |
| Asian people | 33% | 29% | 32% | 5% | 1% |
| Black, African or Afro Caribbean people | 32% | 27% | 35% | 5% | 1% |
| Lesbian, gay, or bisexual people | 32% | 24% | 36% | 7% | 2% |
| People with a different creed or religion than yours |
30% | 27% | 38% | 4% | 1% |
| Indigenous people | 30% | 27% | 34% | 7% | 1% |
| Immigrants | 27% | 28% | 33% | 11% | 2% |
| People with mental health disabilities or addictions |
27% | 29% | 36% | 7% | 1% |
| Transgender people | 25% | 21% | 41% | 10% | 3% |
| Muslim people | 22% | 22% | 35% | 15% | 6% |
| Arab people | 22% | 22% | 36% | 15% | 4% |
| Refugees | 22% | 24% | 35% | 15% | 4% |
| People in receipt of social assistance | 16% | 23% | 40% | 18% | 2% |
In general, women are more likely than men to feel positive about many groups. Feeling positive is largely similar by age, though younger respondents are somewhat more positive about LGBT communities and refugees.
Respondents in specific equity groups are predictably positive about others in their group, and people identifying as LGBTQ or having a disability are among the most positive toward other groups.
Respondents who report experiencing discrimination in the past five years are more likely to express a positive view toward most of the listed groups, with the exception of immigrants. People who have never experienced discrimination are the least likely to be positive.
The findings indicate having a less positive impression of certain groups may be linked to lack of frequent contact. Respondents have less frequent contact with and less positive feelings towards, transgender people, Arab people, Muslim people, refugees and people receiving social assistance. At the same time, respondents do not encounter often but have a very positive impression of people with physical, intellectual or cognitive/learning disabilities.
Do you agree with the statement that “immigrants should adapt to the laws and norms of our society”?[14]
A majority of respondents agree with the statement that immigrants should adapt to our laws and norms (53% strongly agree, 90% agree overall).
Agreement with this statement is generally high across the province and all subgroups, but is somewhat higher among these respondent groups:
- People of Indigenous (95%) or British/European origins (92%)
- Mainstream Protestants (94%) and Jewish people (98%)
- Have not personally experienced discrimination recently or at all (94%)
- Men (93% vs. 88% of women)
- Do not think discrimination is much of a problem in Ontario (93%).
This view increases as age increases and is highest among respondents age 60 and over (98%).
Do you agree with the statement that “it is normal for Ontario to evolve and reflect or adapt to society’s changing cultural diversity”?[15]
Four out of every five respondents (79%) agree to some extent with the statement that it is normal for Ontario to evolve and reflect or adapt to the changing cultural diversity of our society.
Agreeing with this statement is somewhat higher among respondents in Toronto (84%) and younger residents (86% age 18 to 29) and students. Agreement is linked to higher levels of education, and being a member of a racialized group or of non-European origin.
Do you agree with the statement that “we need to be cautious of people who are too open in showing their religious beliefs”?[16]
A majority of respondents (62%) disagree with the statement that you need to be cautious of people who are too open in showing their religious beliefs while 38% agree.
The respondent groups with higher levels of agreement are:
- Men (44% vs. 31% of women)
- Household incomes of $40,000 to under $60,000 (43%)
- Aged 60 and over (42%)
- Catholic/Orthodox practitioners (40%).
Do you agree with the statement that “Ontario is changing too quickly because of ethnic communities”?[17]
Half of respondents (51%) at least somewhat agree with the statement that Ontario is changing too quickly because of ethnic communities.
Respondent groups with higher levels of agreement are:
- High school or lower education (63%)
- Lower household incomes (59% of people with incomes of $40,000 to under $60,000)
- Catholic/Orthodox (59%)
- All Christians (57%)
- Evangelical Christians (56%)
- Aged 45 and over (58%)
- Living in the 905-area (57%)
- Men (54% vs. 49% of women).
Do you agree with the statement that “we would be better off if we stopped letting in so many immigrants”?[18]
A minority of respondents (43%) agree with the statement we would be better off in Ontario if we stopped letting in so many immigrants.
At the same time, slim majorities of people with high school or lower education (55%), people staying at home out of the workforce (51%), Indigenous people (55%) agreed with the statement.
How comfortable are you when seeing people wearing religious or cultural attire?[19]
Respondents were presented with a list and asked to indicate how they feel when they see people in public expressing or wearing attire specific to their religious or cultural identity.
A majority are at least somewhat comfortable seeing people wearing each item. Comfort is highest overall for seeing someone wearing a Christian cross around their neck, or an Indigenous person who keeps their long hair in a ponytail (93% each), and nine in 10 are also at least somewhat comfortable seeing either a Jewish kippah or traditional Mennonite clothing. Four out of five express some level of comfort in seeing men with turbans or women wearing hijabs. Comfort is lowest for seeing a woman in a face-covering niqab.
| Very comfortable |
Somewhat comfortable |
Somewhat uncomfortable |
Very uncomfortable | |
|---|---|---|---|---|
| Someone wearing a Christian cross around their neck |
60% | 32% | 6% | 1% |
| Indigenous person with hair long in a ponytail | 59% | 35% | 5% | 1% |
| Man wearing a kippah (Jewish skull cap) | 53% | 37% | 9% | 1% |
| Traditional Mennonite clothing | 53% | 37% | 8% | 2% |
| Man wearing a turban | 42% | 39% | 15% | 4% |
| Woman wearing a hijab (head scarf) covering hair | 42% | 37% | 15% | 5% |
| Woman wearing a niqab or veil covering her face | 24% | 31% | 27% | 19% |
Comfort with Sikh or Muslim attire is higher among younger people, students and people with higher levels of education (above a high school diploma).
While a majority remain comfortable with women wearing the niqab, a large minority are uncomfortable with it (46% uncomfortable vs. 54% comfortable). Discomfort is higher among mainstream Protestants (55%) and Jewish respondents (58%), and people who have never experienced discrimination personally (50%) or who think discrimination is not very much or at all a problem (57%). Discomfort with women wearing a niqab increases as age increases.
How do you feel about accommodating the needs of specific groups in Ontario?[20]
Three in five respondents say we are not doing enough to accommodate people with mental health disabilities or addictions, and similar numbers say this about the people responsible for caring for family members. Around half feel more could be done to accommodate people with intellectual, cognitive or learning disabilities, or people with physical disabilities. Over four in ten (44%) think more could be done to accommodate Indigenous peoples. Three in 10 (29%) think too much is being done to accommodate French speakers in Ontario.
| We don't do enough | Just the right amount | We do too much | |
|---|---|---|---|
| People with mental health disabilities or addictions |
60% | 36% | 4% |
| People responsible for caring for other family members |
58% | 38% | 4% |
| People with intellectual, cognitive or learning disabilities |
53% | 44% | 4% |
| People with physical disabilities | 51% | 45% | 4% |
| Indigenous peoples | 44% | 40% | 16% |
| Transgender people | 32% | 54% | 14% |
| Pregnant women | 20% | 73% | 7% |
| Immigrants | 17% | 59% | 24% |
| Muslim people | 17% | 58% | 25% |
| People, other than Muslims, who practice a religion |
15% | 71% | 15% |
| French-speakers | 11% | 60% | 29% |
There is a notable gender difference – women are more likely than men to feel more could be done for most of the listed groups. The exception is French speakers, where women’s and men’s views are similar.
Young respondents aged 18 – 29 and students are more likely than older persons to feel most groups deserve more accommodation. However, the views of all respondents are similarly positive for accommodating family member caregivers and people with physical disabilities. Respondents aged 60 and over are also among the most likely to think the four health-related groups could use additional supports. In general, respondents with household incomes under $40,000 are the most likely to say more could be done for the four health-related groups, as well as for Indigenous, transgender and Muslim people.
Non-Christian respondents are more likely than Christian respondents to feel more accommodation should be made for Muslim people as well as for other people who practice a religion.
In general, a minority of respondents think that too much is done to accommodate special groups. This opinion is somewhat higher among people aged 45 to 59, with high school or lower education, or in the $40,000 to under $60,000 household income bracket.
Do you support specific types of accommodations?[21]
Respondents were shown a list of accommodations for specific groups. Support among respondents is highest for accommodating people with physical, mental or learning disabilities or for parents with childcare responsibilities. Strong support is lower for gender or religious/cultural accommodations, but still, seven in 10 or more support these types of accommodations at least somewhat.
| Strongly support | Somewhat support | Somewhat oppose | Strongly oppose | |
|---|---|---|---|---|
| Installing small wooden curb ramp for wheelchairs/walkers |
77% | 20% | 3% | 0% |
| Allowing a service animal in a buffet restaurant | 61% | 29% | 8% | 2% |
| Giving student with a learning disability longer to finish an exam |
60% | 33% | 6% | 2% |
| Rearranging work schedules to allow parent to pick up child | 52% | 38% | 8% | 3% |
| Allowing someone time off from work for addiction treatment |
48% | 42% | 8% | 3% |
| Allow transgender students to use washrooms based on lived identity |
37% | 36% | 16% | 11% |
| Prison cafeterias accommodating religious dietary requirements |
32% | 42% | 15% | 11% |
| Allowing extra time away for religious or cultural reasons |
29% | 43% | 18% | 10% |
| Providing a prayer space for students | 29% | 42% | 17% | 12% |
A majority of respondents (73%) at least somewhat support transgender students using washrooms that correspond with their lived gender identity. A similar majority (71%) also support providing a prayer space in schools for students.
Support for physical and learning accommodations is highest among respondents in Northern Ontario, but otherwise there are few regional differences of note.
Personal experience with discrimination
Did you experience discrimination or harassment in the past five years? [22]
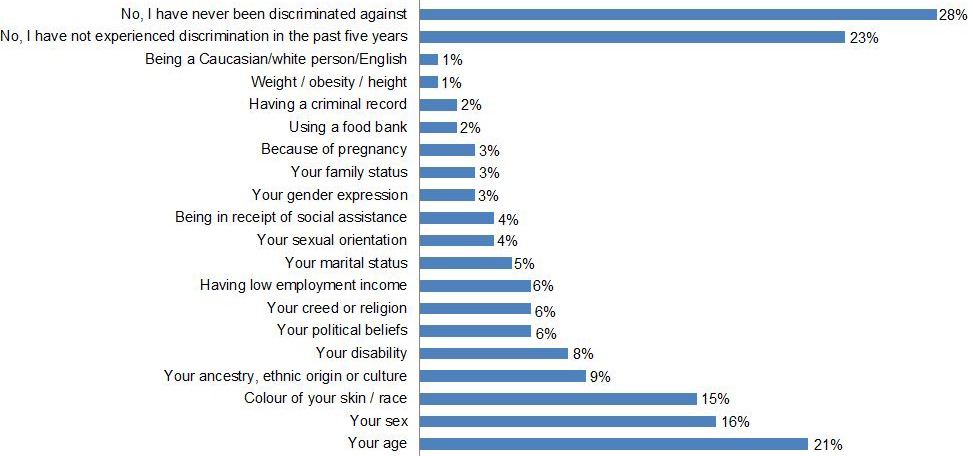
Half (49%) of respondents say they have experienced at least one form of discrimination in the past five years.[23] Another quarter (23%) say they have not, and just under three in 10 (28%) have never experienced any of these forms of discrimination.
The most common types of discrimination reported are based on age (21%), gender (16%), and skin colour or race (15%). Around one in 10 reports discrimination due to ancestry/ethnicity or due to a disability.
More younger respondents and people aged 60 or over report age discrimination (33% and 23% respectively), while more women report discrimination based on sex (26% vs. 6% of men).
Graph 2: Incidence of discrimination of specific types in past five years
Discrimination based on skin colour, race or ethnicity is highest among Black, South Asian and Chinese/South East Asian respondents. Christians and Muslims are most likely to report discrimination based on religion.
| Colour of Skin / Race | Ancestry / Ethnicity | |
|---|---|---|
| Total | 15% | 9% |
| Black | 70% | 18% |
| South Asian | 50% | 19% |
| All non-European | 42% | 23% |
| Chinese / South East Asian | 36% | 23% |
| Latin American | 30% | 45% |
| Indigenous | 21% | 21% |
| Arab / West Asian | 8% | 21% |
| British / European | 6% | 5% |
A large majority of Black respondents (70%) report experiencing discrimination based on skin colour or race in the past five years. Of respondents living in the City of Toronto, 27% say they experienced discrimination based on skin colour or race in the same period, compared to respondents across the province overall (15%).
Did you experience sexual harassment?[24]
Overall, 7% of respondents say they experienced sexual harassment in the past five years. About one in 10 women (11%) say this happened to them compared to 3% of men.
Experience of sexual harassment is higher among these respondent groups:
- LGBTQ (24%)
- Indigenous (20%)
- Staying at home out of the workforce (15%)
- Aged 18 – 29 (14%)
- Household incomes under $40,000 (12%)
- People with disabilities (11%)
- Born in Canada (8%) vs. another country (4%).
Of the women who experienced any form of discrimination in the past five years, one in five (20%) say at least one incident involved sexual harassment.
Where did the discrimination or harassment occur the last time?[25]
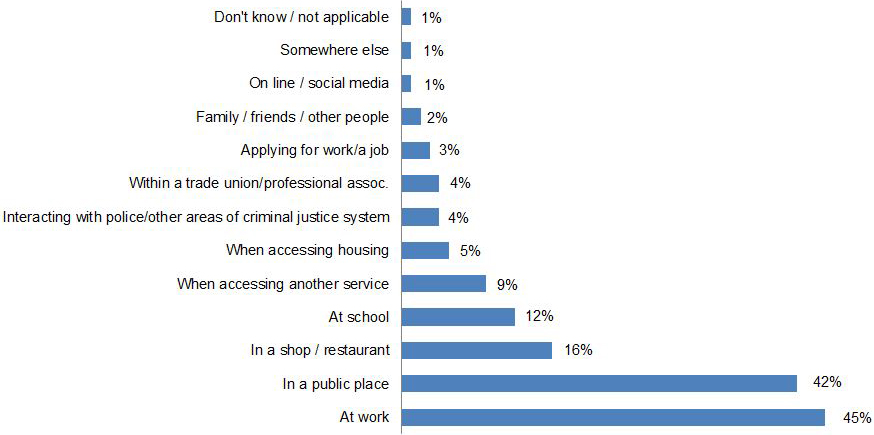
Just under half (45%) of respondents who experienced discrimination or harassment in the past five years say it happened at work, and 42% say it happened in a public place. One in six (16%) say it was in a shop or restaurant, and 12% say it happened at school.
Discrimination at work is reported somewhat more by these respondent groups:
- Muslim (66%)
- Post-graduate degrees (56%)
- Household incomes of $100,000 to under $150,000 (56%)
- Indigenous (55%)
- Living in south western Ontario (54%)
- Aged 45 – 59 (52%)
- Working full time (52%).
Graph 3: Location of most recent discrimination
Staying at home out of the workforce (59%)Discrimination in public places is reported more by these respondent groups:
- Chinese/South East Asian (54%)
- Younger (53% age 18 – 29)
- Members of a racialized group (49%)
- Household incomes under $40,000 (49%)
- Living in Toronto (49%).
Although the number of respondents is very small, a high proportion (83%) of respondents who identify as transgender report discrimination in a public place.
How did you respond last time to the discrimination or harassment?[26]
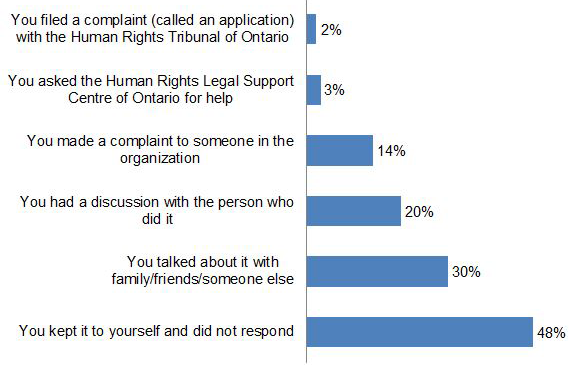
About half of respondents who experienced discrimination in the past five years kept it to themselves and did not respond. Three in 10 discussed it with someone else, and two in 10 discussed the incident with the person who did it. One in seven made a complaint to someone in the organization involved. Only very a small proportion of respondents say they approached either the Human Rights Legal Support Centre (3%) or the Human Rights Tribunal of Ontario (2%).
Graph 4: Response to most recent discrimination
- Ages 45 – 59 (22%)
- Christian (18%)
- Full-time workers (17%).
Criminal justice
Did you think the police would be justified in profiling or targeting specific groups?[27]
When asked about police profiling in general, two-thirds (65%) of respondents agree to some extent that police must treat everyone equally regardless of group identity. One-third (35%) lean towards allowing police to profile communities that supposedly commit more crime.
The view that police should treat everyone equally is somewhat higher among these respondent groups:
- Students (83%)
- Muslim (77%)
- Aged 18 – 29 (76%)
- Household incomes under $40,000 (74%)
- Women (70%)
- Think discrimination is somewhat of a problem in the province (70%)
- Practicing no religion (68%).
Overall, a minority think that police profiling is at least sometimes necessary. This response is somewhat higher among men (41%).
When asked about police profiling of specific groups, just under six in 10 respondents or more (depending on the group) feel police profiling is never or rarely justified. Around four in 10 think it is at least sometimes justified for police to profile or target certain groups: Muslims, Arab people, young people, Black/African Canadians, South Asians or people with mental health disabilities or addictions. The lowest levels of acceptance of police profiling are for people who identify a LGBTQ. Just over one-third of respondents (36%) do not indicate any group they think police would be justified in profiling or targeting.
| Never Justified |
Rarely justified |
Sometimes justified | Always justified | |
|---|---|---|---|---|
| Lesbian, gay, or bisexual people | 35% | 37% | 23% | 5% |
| Transgender people | 34% | 38% | 23% | 5% |
| Chinese people | 30% | 38% | 27% | 5% |
| Southeast Asian people | 28% | 37% | 31% | 5% |
| Latin American people | 28% | 38% | 30% | 4% |
| Indigenous peoples | 27% | 36% | 32% | 5% |
| People with mental health disabilities and addictions |
27% | 35% | 34% | 5% |
| Black/African-Canadian people | 27% | 33% | 34% | 6% |
| Young people | 26% | 33% | 36% | 5% |
| South Asian people | 26% | 35% | 33% | 6% |
| Homeless people | 24% | 38% | 34% | 5% |
| Arab people | 24% | 34% | 35% | 7% |
| Muslim people | 24% | 32% | 35% | 9% |
First Nations, Métis and Inuit (Indigenous) peoples
Experience with discrimination
A higher proportion of Indigenous respondents (70% vs. 49% of all respondents) say they experienced some form of discrimination in the past five years – 21% say it’s because of their ancestry, ethnic origin or culture (vs. 9% of all respondents).[28]
Indigenous respondents are somewhat more likely than people of other origins to report discrimination because of:
- Disability (25% vs. 8% overall)
- Low employment income (17% vs. 6% overall)
- Receiving social assistance (17% vs. 4% overall
- Sexual orientation (14% vs. 4% overall).
Indigenous respondents are also more likely to say that at least one of the incidents of discrimination involved sexual harassment (29% vs. 14% of all overall).[29]
A higher proportion of Indigenous respondents also say that the last time they experienced discriminatory treatment was at work (58% vs. 45% overall).[30]
When discrimination did occur, a higher proportion of Indigenous respondents did something about it:[31]
- 31% had a discussion with the person who did it (vs. 20% overall)
- 19% complained to someone in the organization where it happened (vs. 14% overall)
- 11% asked the Human Rights Legal Support Centre for help (vs. 3% overall).
Awareness about rights
One in four Indigenous respondents (24%) say discrimination and harassment is a major problem in Ontario, compared to 12% of all respondents.[32]
One in four Indigenous respondents (25%) say being in receipt of social assistance is a common reason people in Ontario experience discrimination (compared to one in 10 of all respondents).[33]
Around two-thirds (68%) of Indigenous respondents say that human rights are at least somewhat well protected in Ontario (compared to 75% of all respondents.[34]
Indigenous respondents report more familiarity with Ontario’s human rights system than respondents overall:[35]
- 67% say they are at least somewhat familiar with the Code (vs. 55% of respondents overall)
- 53% are at least somewhat familiar with the OHRC (vs. 48% overall)
- 47% are at least somewhat familiar with the HRLSC (vs. 25% overall)
- 44% are at least somewhat familiar with the HRTO (vs. 36% overall).
Respondents overall say they are familiar at least to some extent with Indigenous or Aboriginal rights (35%) and with the impact of colonialism on Indigenous peoples (34%). Indigenous respondents are more likely to be familiar with these issues (57% and 46%).
Attitudes towards Indigenous peoples
Just over half of respondents (56%) say they have at least some contact or interact with Indigenous peoples.[36]
A higher proportion of Indigenous respondents say they have contact with certain groups compared to all respondents:
- People with physical or intellectual, cognitive or learning disabilities (86% vs. 71%)
- People with mental health disabilities or addictions (86% vs. 66%)
- People receiving social assistance (86% vs. 61%)
- Lesbian, gay or bisexual people (85% vs. 71%)
- Transgender people (52% vs. 34%).
When asked about personal feelings towards specific groups in society, 57% of all respondents say they feel at least somewhat positive towards Indigenous peoples.
When asked about seeing Indigenous people who keep their hair long in a ponytail, the vast majority of respondents (93%) say they are comfortable with this public expression of identity.[37] When asked about accommodating the needs of Indigenous peoples, 44% say that not enough is done, while only 16% say too much is done.[38]
When asked if they agreed with the negative statement that Indigenous people receive too many government benefits, 49% of respondents overall hold this view. Slim majorities of specific respondent groups also hold this view:[39]
- Living in Northern Ontario (55%)
- Men (54% vs. 44% of women)
- Household incomes of $100,000 to under $150,000 (54%)
- Christian (53%)
- Have never experienced discrimination (53%)
- Working full time (52%)
- Chinese and South East Asian (51%).
The view that Indigenous people receive too many government benefits increases as age increases, and is highest among respondents aged 60 and over (55%), and among retired persons (55%).
Over one third (37%) of respondents hold the negative view that police are at least sometimes justified in targeting or profiling Indigenous people.[40]
Poverty and low income
Experience with discrimination
Overall, 4% of respondents say they experienced discrimination in the past five years as a result of being in receipt of social assistance.[41] Certain respondent groups are more likely to say this:
- Unemployed and/or receiving disability assistance (21%)
- Indigenous peoples (17%)
- Identify as LGBTQ (15%)
- People with disabilities (12%)
- Household incomes of under $40,000 (11%)
- High school or lower education (9%).
Similarly, these respondent groups are also more likely to say they experience discrimination because of having low employment income:
- Unemployed and/or receive disability assistance (21%)
- Identify as LGTBQ (15%)
- Household income of under $40,000 (14%)
- People with disabilities (12%)
- Aged 18-29 (11%)
- High school or lower education (11%).
Overall, 6% of respondents hold this view.
Two percent of respondents reported using a food bank as the reason they experienced discrimination in the past five years.
Respondents with household incomes of under $40,000 are more likely to say that at least one of the incidents of discrimination involved sexual harassment (21% vs. 14% of all respondents).[42]
A greater proportion of respondents who are unemployed and/or receiving disability assistance (9%), or with household income under $40,000 (8%), say that the last time they experienced discrimination was when interacting with police or other areas of the criminal justice system (vs. 4% of all respondents).[43]
Awareness about rights
One in six respondents (17%) with an annual household income of less than $40,000 say discrimination and harassment is a major problem in Ontario, while 12% of all respondents say this.[44]
One in seven respondents (14%) with this lower income say being in receipt of social assistance is another common reason why people in Ontario experience discrimination, while one in 10 respondents overall say this.[45]
Respondents with this lower income report less familiarity with Ontario’s human rights system than respondents overall:[46]
- 51% say they are not very, or not at all, familiar with the Code (vs. 45% of all respondents)
- 62% are not very, or not at all, familiar with the OHRC (vs. 51%)
- 69% are not very, or not at all, familiar with the HRTO (vs.64%)
- 81% are not very, or not at all, familiar with the HRLSC (vs. 75% overall).
Attitudes towards people receiving social assistance
Three in five respondents (61%) say they have at least some contact or interact with people receiving social assistance.[47]
A higher proportion of respondents with annual household incomes of less than $40,000 say they have more contact with certain groups, compared to respondents overall:
- People receiving social assistance (72% vs. 61% overall)
- People with mental health disabilities or addictions (72% vs. 66%)
- Indigenous peoples (63% vs. 56%)
- Transgender people (42% vs. 34%).
When asked about personal feelings towards specific groups in society, only 39% of respondents say they feel at least somewhat positive towards people in receipt of social assistance. Respondents are least positive towards this group compared to other groups. Positive feelings towards people in receipt of social assistance increase to 51% for students, 70% for Sikhs, and 71% for Muslims who practice their religion.[48]
Overall, 63% of respondents agree with the purposefully polarizing statement that we do enough to help people on social assistance, they could do more to help themselves if they wanted to. Majorities of many different respondent groups also hold this negative view.[49]
When asked if they agreed with the statement that it is understandable for a property owner or apartment manager to be concerned about renting to people on social assistance, 62% of all respondents hold this negative view.[50] This view is somewhat higher among these respondent groups:
- British/European origins (76%)
- Household incomes of $100,000 to $150,000 (68%) and $150,000 and over (65%)
- Think that discrimination is not very much or at all a problem in Ontario (68%)
- Have never experienced discrimination (67%)
- Bachelor’s degree (66%)
- College graduates (64%).
However, only around one in seven respondents (14%) strongly agree with this statement.
When asked whether police are at least sometimes justified in targeting or profiling homeless people, 38% of respondents agree with this negative view.
When asked their opinion on the statement that employers should prioritize hiring people born in Canada rather than immigrants when jobs are scarce, 50% of respondents agreed with this negative view.[51] Agreement is in the majority among these respondent groups:
- Indigenous peoples (72%)
- High school or lower education (63%)
- Staying at home out of the workforce (63%)
- Living in Northern Ontario (62%)
- Household incomes from $60,000 to under $80,000 (60%)
When asked their opinion on the statement that some jobs are better suited to men, some to women, a considerably higher proportion of men (61% vs. 45% of women) agree with this negative view.[52] Agreement with this statement is also higher among respondents aged 60 and over (57%).
[1] Table Q.2, cross-tabulation data file.
[2] Lesbian, gay, bisexual, transgender, queer or questioning
[3] Table Q.3, cross-tabulation data file.
[4] Table Q.4, cross-tabulation data file.
[5] Table Q.5, cross-tabulation data file.
[6] Table Q.6, cross-tabulation data file.
[7] Table Q.10, cross-tabulation data file.
[8] Table Q.10, cross-tabulation data file.
[9] Some of the questions are based on a series of provocative statements intent on eliciting the candid views of respondents.
[10] Table Q.7, cross-tabulation data file.
[11] Table Q.19, cross-tabulation data file.
[12] Table Q.8, cross-tabulation data file.
[13] Respondents were asked this question earlier in the survey before being asked about their frequency of contact with the same 15 specific groups.
[14] Table Q.10E, cross-tabulation data file.
[15] Table Q.10F, cross-tabulation data file.
[16] Table Q.10H, cross-tabulation data file.
[17] Table Q.10D, cross-tabulation data file.
[18] Table Q.10A, cross-tabulation data file.
[19] Table Q.11, cross-tabulations data file.
[20] Table Q.9, cross-tabulations data file.
[21] Table Q.18, cross-tabulations data file.
[22] Table Q.14, cross-tabulation data file.
[23] Respondents were shown a list of possible types of discrimination and asked to indicate which, if any, they have personally experienced in the past five years (multiple mentions were permitted).
[24] Table Q.15, cross-tabulation data file.
[25] Table Q.16, cross-tabulation data file.
[26] Table Q.17, cross-tabulation data file.
[27] Tables Q.12 and Q.13, cross-tabulation data file.
[28] Table Q.14, cross-tabulations data file.
[29] Tables Q.15, cross-tabulations data file.
[30] Tables Q.16, cross-tabulations data file.
[31] Table Q.17, cross-tabulations data file.
[32] Table Q.2, cross-tabulations data file.
[33] Table Q.3, cross-tabulations data file.
[34] Table Q.4, cross-tabulations data file.
[35] Tables Q.6, cross-tabulations data file.
[36] Tables Q.19, cross-tabulations data file.
[37] Tables Q.11, cross-tabulations data file.
[38] Tables Q.9, cross-tabulations data file.
[39] Tables Q.10, cross-tabulations data file.
[40] Tables Q.13, cross-tabulations data file.
[41] Table Q.14, cross-tabulations data file.
[42] Tables Q.15, cross-tabulations data file.
[43] Tables Q.16, cross-tabulations data file.
[44] Table Q.2, cross-tabulations data file.
[45] Tables Q.3, cross-tabulations data file.
[46] Tables Q.6, cross-tabulations data file.
[47] Table Q.19, cross-tabulations data file.
[48] Tables Q.8, cross-tabulations data file.
[49] Tables Q.10, cross-tabulations data file.
[50] Tables Q.10, cross-tabulations data file.
[51] Tables Q.10, cross-tabulations data file.
[52] Tables Q.10, cross-tabulations data file.