By the Numbers: A statistical profile of people with mental health and addiction disabilities in Ontario
Approved by the OHRC: 2015
Available in accessible formats on request
PDF recommended for assistive technology
The OHRC acknowledges the technical support received from the Canadian Human Rights Commission and particularly Eric Diotte, Senior Researcher, who provided insight and expertise that greatly helped in developing this report.
Key findings
Ontarians with mental health and addiction disabilities have lower levels of education, lower income, are less likely to take part in the labour force and are less likely to live in adequate, affordable housing compared to people with other disabilities and people without disabilities. The following results are from the 2012 Canadian Survey on Disability, which surveyed people aged 15 and over:
- 15.4% of Ontarians report having a disability – that is, they have difficulty performing tasks as a result of a long-term condition or health-related problem and experience a limitation in their daily activities. Of this 15.4%, 4.8% report a mental health or addiction disability, and 10.6% report other disabilities. In other words, of all Ontarians who report a disability, almost one-third (30.9%) report a mental health or addiction disability.
- The prevalence of mental health and addiction disabilities is slightly higher among Ontarians (4.8%) than people across Canada (3.9%). The same is true for people with other disabilities (10.6% among Ontarians and 9.9% among Canadians).
- The vast majority of Ontarians who report a mental health disability or addiction also report having another type of disability (90.5%).
- A greater proportion of people with mental health or addiction disabilities in Ontario report having severe or very severe disabilities (73.8%) compared to people with other disabilities (39.5%).
- A slightly greater proportion of women (5%) than men (4.5%) in Ontario report mental health or addiction disabilities.
- A greater proportion of people with mental health and addiction disabilities are younger (aged 15-34 years) and in mid-life (aged 35-54 years) than people with other disabilities. People aged 15-24 account for 9.3% of all Ontarians who report mental health and addiction disabilities, which is more than twice the proportion of people with other disabilities (3.5%).
- More than twice the proportion of Indigenous peoples in Ontario living off reserve (12%) report mental health and addiction disabilities compared to non-Indigenous people (4.6%).
- Racialized people in Ontario report lower prevalence of mental health and addiction disabilities (3.3%) compared to non-racialized people and Indigenous peoples (5.3% for both groups combined).
- A higher proportion of Ontarians with mental health and addiction disabilities are separated or divorced (19.3%) than people with other disabilities overall (10.4%) and people without disabilities (7.1%). A smaller proportion of Ontarians with mental health or addiction disabilities are married or in a common-law relationship (45.6%) than people with other disabilities overall (60.6%) or people without disabilities (59.8%).
- Ontarians with mental health and addiction disabilities generally report lower levels
of education compared to people without disabilities:- Over a quarter of people with mental health and addiction disabilities (25.9%) and people with other disabilities (28.8%) have not completed high school. This compares to 16.4% of people without disabilities
- A much smaller proportion of people with mental health and addiction disabilities have a university degree (8.5%) than people without disabilities (24.8%)
- A somewhat greater proportion of people with mental health and addiction disabilities have completed a college diploma or a trade certificate (33.9%) compared to people with other disabilities (29.1%) and people with no disabilities (30.7%).
- Ontarians with mental health and addiction disabilities are more at risk of poverty than people without disabilities. A greater proportion (19.6%) are in low-income status compared to people with no disabilities (10.4%) and people with other disabilities (7.9%).
- Ontarians with mental health and addiction disabilities are less likely to be in the labour force and more likely to be unemployed:
- In 2011, 201,220 people, or 54% of people with mental health and addiction disabilities between the ages of 15 and 64, were not in the labour force, compared to 42.9% of people with other disabilities and 21% of people without disabilities
- The unemployment rate of Ontarians aged 15-64 with mental health or addiction disabilities in 2011 (22.6%) was more than twice as high as Ontarians with other disabilities (9%), and almost three times higher than Ontarians without disabilities (7.7%).
- Many people with disabilities perceive they have been discriminated against in employment, regardless of disability type. A substantially high proportion of people with mental health and addiction disabilities (67.7%) report being disadvantaged at work due to their condition.
1. Introduction
Many Ontarians with mental health or addiction disabilities experience significant disadvantage in society, such as chronic poverty, lower levels of education, lack of access to affordable housing, high unemployment and lack of societal supports. Discrimination, which arises from negative attitudes, stereotypes and systemic practices, is a significant barrier, and may contribute to these social and economic disadvantages. Discrimination against people with mental health and addiction disabilities persists despite the protection of the Ontario Human Rights Code (the Code). The Code is the law that provides for equal rights and opportunities without discrimination in employment, housing, services and other areas based on 17 grounds, including disability.
In its 2009-2011 consultation on mental health, the Ontario Human Rights Commission (OHRC) heard extensively from individuals, advocates, organizations and families about the multiple barriers facing people with mental health and addiction disabilities. These are documented in Minds that matter: Report on the consultation on human rights, mental health and addictions.[1] However, in its report, the OHRC could not build a comprehensive portrait of the lives of people with mental health and addiction disabilities using publicly available statistics, because of the limited Ontario-based data available.[2]
The OHRC has therefore decided to produce its own detailed report that examines several indicators of social and economic status for people with mental health and addiction disabilities. These indicators are:
- Prevalence and severity
- Housing
- Education
- Labour force
- Discrimination in the workplace
- Income.
More specifically, this report highlights the unique disadvantages that people with mental health and addiction disabilities experience in different social and economic areas. Showing these disadvantages can help policy makers, government, researchers, disability groups and service providers in their work to protect the human rights of people with disabilities, including people with mental health or addiction disabilities. It will raise awareness by helping to develop a common understanding of the significant social and economic disparities faced by Ontarians with mental health disabilities, addictions and other disabilities. The OHRC hopes that this report will be used as a tool to promote change to close these gaps.
This report can also be useful for individuals and groups with disabilities when filing claims at the Human Rights Tribunal of Ontario (HRTO) or other legal venues. A person or group doesn’t need to compare themselves to others to show that they experienced discrimination. However, statistical comparisons can sometimes help to identify discrimination – for example, in systemic discrimination cases.
Finally, this information can provide a baseline for comparison for future years. It can also contribute to Canada’s reporting obligations under the United Nations’ Convention on the Rights of Persons with Disabilities.[3]
[1] Ontario Human Rights Commission, Minds that matter: Report on the consultation on human rights, mental health and addictions (Toronto: Government of Ontario, 2012) online: Ontario Human Rights Commission www.ohrc.on.ca/en/minds-matter-report-consultation-human-rights-mental-h.... In Minds that Matter, the OHRC recommended:
2. The Government of Ontario should measure and report to the public of Ontario on the inequities that create the conditions for discrimination against people with mental health disabilities or addictions (such as unemployment and low income) and efforts to address these conditions. Such a report should be submitted to the federal government as part of its reporting requirements under Article 35 of the [United Nations’ Convention on the Rights of Persons with Disabilities] (at 19).
[2] Since then, Statistics Canada has released the Canadian Community Health Survey – Mental Health (CCHS-MH), 2012, which surveyed Canadians about six kinds of mental health and addiction disabilities. More information about this survey can be found in Caryn Pearson, Teresa Janz and Jennifer Ali, “Mental and substance use disorders in Canada” (September 2013) Health at a Glance, Statistics Canada Catalogue no. 82-624-X online: Statistics Canada www.statcan.gc.ca/pub/82-624-x/2013001/article/11855-eng.htm (retrieved April 21, 2015). The CCHS-MH does not make comparisons between people with mental health and addiction disabilities and people with other types of disabilities. For this reason, the data relied upon in this report is from the CSD. See also Christine Bizier, Carley Marshall and Gail Fawcett, Canadian Survey on Disability, 2012 – Mental health-related disabilities among Canadians aged 15 years and older, 2012, Statistics Canada Catalogue no. 89-654-X. Ottawa, Ontario. December 3, 2014.11 p. online: Statistics Canada www5.statcan.gc.ca/olc-cel/olc.action?objId=89-654-X2014002&objType=46&lang=en&limit=0 (retrieved January 20, 2015).
[3] On an international level, the rights of people with disabilities are outlined in various instruments, notably the United Nations’ Convention on the Rights of Persons with Disabilities (CRPD). As one of the countries that have ratified this treaty, Canada has agreed to take progressive steps to make sure that people with disabilities have equal opportunity and are free from discrimination in all areas of life. The CRPD lays out various rights of persons with disabilities, including rights to an adequate standard of living and social protection (Article 28), education (Article 24), and work and employment (Article 27). Canada also agreed to collect appropriate statistical information to help create policies to implement the CRPD and identify the barriers that people with disabilities face (Article 31). See also Convention on the Rights of Persons with Disabilities, 13 December 2006, U.N.T.S. vol. 2515, p.3 [CRPD], (entered into force 3 May 2008, accession by Canada 11 March 2010) online: Office of the United Nations High Commissioner for Human Rights www.ohchr.org/EN/HRBodies/CRPD/Pages/ConventionRightsPersonsWithDisabili... (retrieved March 31, 2015).
2. Methodology
To prepare this report, the OHRC worked with Statistics Canada to identify the appropriate variables from different surveys. The OHRC received customized data tables, based on the methodology and analysis used by Statistics Canada.
2.1. Data sources
Canadian Survey on Disability, 2012 (CSD):
The primary data source for this report was the CSD, a post-census survey conducted in 2012. The CSD is based on a nationwide sample of people with disabilities, aged 15 years and older, who were living in Canada at the time of the National Household Survey (NHS) (May 10, 2011) and reported on the NHS[4] an activity limitation associated with a physical or mental condition or health problem. The total sample size for the CSD was 45,443 people.[5]
The CSD uses disability screening questions to ask Canadian adults how often their daily activities are limited by long-term conditions, health problems and task-based difficulties.[6] It asks questions about people’s sources of income, specific limitations, needs (such as for assistive devices or accommodation) and experiences in several areas, including daily life, the workplace, education, workplace training and getting around the community. It also asks questions relating to workplace discrimination.
Participation and Activity Limitation Survey, 2006 (PALS):
Because the necessary variables to measure “core housing need” were not available from the CSD at the time, data from the Participation and Activity Limitation Survey, 2006 (PALS)[7] is used in section 3.3.2. The PALS was a national post-census survey, which used the 2006 Census as a sampling frame to identify people with disabilities. The PALS collected information about children and adults whose “daily activities are limited by a physical, mental or other health-related condition or problem.”[8]
Note that results from the PALS cannot be compared to the results from the CSD.[9]
2.2. Terminology
Mental health and addiction disabilities are characterized differently under the Code and the CSD.
The Code defines “disability” broadly under section 10(1), and covers mental health disabilities under subsection (b) a “condition of mental impairment” and (d) “mental disorder.” The OHRC takes an expansive and flexible approach to defining mental health disabilities and addictions that are protected by the Code. The Code does not list all the conditions that could be considered a disability. However, many mental health and addiction impairments are well-recognized as “disabilities” that are protected by human rights law.[10]
In the CSD, people were identified as having a disability if they had “difficulty performing tasks as a result of a long-term condition or health-related problem and experienced a limitation in their daily activities.”[11] The CSD uses the term “mental/psychological disability” to refer to people with both mental health disabilities and addictions. People with mental/psychological disabilities are considered to be people who report an emotional, psychological or mental health condition that is expected to last for six months or more. These may include anxiety, depression, bipolar disorder, substance abuse, anorexia and other mental health and addiction disabilities.
Disabilities other than mental health and addiction disabilities are collapsed into one group for comparison in this report. Other types of disabilities identified in the CSD are seeing, hearing, mobility, flexibility, dexterity, pain, learning, developmental and memory disabilities.
Throughout this report, the term “mental health and addiction disabilities” will be used in the text, and the term “mental/psychological disability” will be used in the tables and graphs. People with disabilities that are not mental health or addiction disabilities will be called “people with other disabilities.”
2.3. Limitations
The CSD only surveyed persons living in private dwellings in Canada. Not included in the survey were people living on a First Nations reserve, children under age 15, and people who were institutionalized or living in collective dwellings, such as some older people.[12] Similarly, people with psychiatric disabilities who were institutionalized, living in group homes or lodging houses were not included in the sample. Also, the limitations in the questions used to screen people into the CSD means that the number of people who report mental health and addiction disabilities is likely underestimated.[13]
The sample size of people with disabilities and people with mental health and addiction disabilities is low in the CSD. As a result, it was necessary to combine some categories of analysis or drop some measures for privacy reasons. In addition, some estimates could not be reported due to Statistics Canada’s data suppression rules around small sample sizes that protect the privacy of the individuals surveyed.
The category “mental/psychological disability” groups together several different mental health and addiction disabilities. The category “other disabilities” also groups together a broad range of disabilities, including mobility, pain, sensory and cognitive disabilities. The OHRC cannot make conclusions about the outcomes of people with any one disability on the social and economic indicators. Indeed, the OHRC recognizes that the experiences reported on the survey may differ significantly for particular groups based on the type of disability reported by the individuals.
There are many ways to interpret and explain these findings. Without additional information, it is difficult to definitively conclude that the reason behind these disparities is discrimination. However, the results do point to areas that can be examined further.
2.4. Analysis
In this report, proportions are used to compare the situation of people with mental health and addiction disabilities to people with other disabilities and people without disabilities on several different indicators and measures.[14] Select comparisons between people in Ontario and people across Canada are also made (Canada includes Ontario). By so doing, statistically significant differences between groups can give an indication of whether inequality exists.
The purpose of using comparisons between people with mental health and addiction disabilities and people with other disabilities is not to minimize the experience of any group or set up a “hierarchy of oppression” based on disability. Rather, it is to show where gaps exist and to understand the unique societal barriers facing people who report mental health and addiction disabilities.
The coefficient of variation (CV) was used to determine reliability of the data.[15] Statistical tests were run on all comparisons to determine if differences in proportions were significant at the 0.05 level. Where differences are not significant, this is noted as a legend in the table. In addition, missing values were removed from the analysis when appropriate.
[4] The NHS is a nationwide voluntary survey, sent to 4.5 million households. It asks questions about social and economic factors, including language, income, immigration, work, labour, commuting, religion and others. Approximately 200 NHS variables were linked to the CSD analytical files, both for persons with a disability and for persons without a disability. Statistics Canada, no date. NHS Profile, 2011 – About the data. Last updated May 9, 2014. Online: Statistics Canada www12.statcan.gc.ca/nhs-enm/2011/dp-pd/prof/help-aide/aboutdata-aproposdonnees.cfm?Lang=E (Retrieved April 21, 2015).
[5] Statistics Canada, no date. Canadian Survey on Disability (CSD). Last updated August 23, 2012. online: Statistics Canada www23.statcan.gc.ca/imdb/p2SV.pl?Function=getSurvey&SDDS=3251#a2 (retrieved May 9, 2014).
[6] Statistics Canada, Canadian Survey on Disability, 2012: Concepts and Methods Guide (2014) Statistics Canada Catalogue no. 89-654-X — No. 2014001. Ottawa, Ontario. Online: Statistics Canada www.statcan.gc.ca/pub/89-654-x/89-654-x2014001-eng.htm (retrieved April 21, 2015) at 7.
[7] See the glossary for a definition of “core housing need.”
[8] Statistics Canada, Participation and Activity Limitation Survey 2006, Tables (Part VI) (2010) Statistics Canada Catalogue no. 89-628-X — No. 015. Ottawa, Ontario. online: Statistics Canada www.statcan.gc.ca/pub/89-628-x/89-628-x2010015-eng.htm (retrieved May 29, 2014).
[9] The CSD disability screening questions represent a social model of disability, rather than a medical model. This is in accordance with Article 31 of the CRPD. Statistics Canada describes the social model:
The social model is based on the premise that disability is the result of the interaction between a person’s functional limitations and barriers in the environment, including social and physical barriers that make it harder to function day-to-day. Thus, disability is a social disadvantage that an unsupportive environment imposes on top of an individual’s impairment.
(Mackenzie, Andrew, Matt Hurst and Susan Crompton (2009). Living with disability series, Defining disability in the Participation and Activity Limitation Survey, Canadian Social Trends, 2009/12. Statistics Canada catalogue no. 11-008-X as cited in Statistics Canada, Canadian Survey on Disability, 2012: Concepts and Methods Guide, supra note 6 at 5). For more information on the disability screening questions, see Statistics Canada, Concepts and Methods Guide, supra note 6 at 7.
[10] Many impairments have been recognized as disabilities under the Code, including anxiety, panic attacks, depression, schizophrenia, alcohol dependence, and addictions to illegal drugs. For more information, see Ontario Human Rights Commission, Policy on preventing discrimination based on mental health disabilities and addictions (Toronto: Government of Ontario, 2014) online: OHRC www.ohrc.on.ca/en/policy-preventing-discrimination-based-mental-health-disabilities-and-addictions.
[11] Statistics Canada, “Canadian Survey on Disability, 2012.” The Daily. December 3, 2013. Statistics Canada Catalogue Number 89-654-X. online: Statistics Canada www.statcan.gc.ca/daily-quotidien/131203/dq131203a-eng.htm (retrieved May 26, 2014).
[12] Statistics Canada, Canadian Survey on Disability, 2012: Concepts and Methods Guide, supra note 6 at 5.
[13] See Statistics Canada, no date. The 2012 Canadian Survey on Disability (CSD) and the 2006 Participation and Activity Limitation Survey (PALS). Last updated November 29, 2013. Online: Statistics Canada www23.statcan.gc.ca/imdb-bmdi/document/3251_D6_T9_V1-eng.htm, (retrieved September 2, 2014): “While the CSD and the [Disability Screening Questions] are considered to be a big step forward in improving the measurement of disability using the social model, it should be noted that the CSD sample was pre-filtered using the same filter questions on the 2011 National Household Survey (NHS) as those used on the 2006 Census long form for the PALS. Follow up studies have shown that these filter questions do not adequately identify people with mental/psychological or cognitive disabilities. This means that the CSD continues to have some of the weaknesses that the PALS had with respect to undercoverage of some disability types.”
[14] People who reported experiencing both a mental health or addiction disability and one or more other disability type(s) were considered to have a mental health and addiction disability.
[15] The following values are used:
- When the CV is greater than 33.3%, the results are considered unacceptable and not published. It is indicated by an F.
- When the CV is greater than 16.5% and less than or equal to 33.3%, the results are considered poor and must be used with caution. It is indicated with an E.
- When the CV is 16.5% or less, the results are considered "acceptable" and are published without restrictions.
3. Results
This section provides a snapshot of persons with mental health and addiction disabilities. It also looks at these socio-economic indicators: housing, education, labour force, discrimination in the workplace and income.
3.1. Prevalence of disability
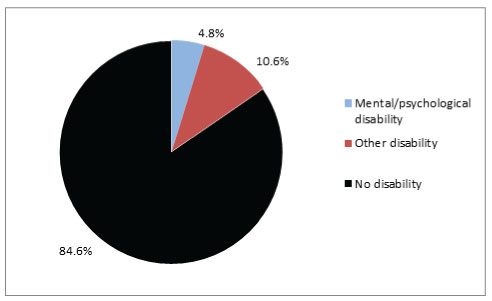
Figure 1. Prevalence of disability among adults aged 15 and older, Ontario, 2012
Source: Adapted from Statistics Canada, Custom Tabulation, Canadian Survey on Disability, 2012.
Percentages are rounded to the nearest one decimal point.
E use with caution.
Overall, 15.4% of Ontarians aged 15 and over report having a disability, with 4.8% reporting a mental health disability or addiction and 10.6% reporting another disability.
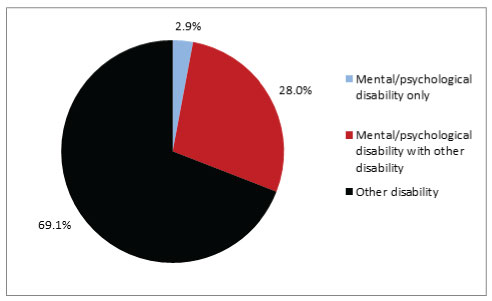
Figure 2. Prevalence of disability among adults with disabilities aged 15 and older by disability type, Ontario, 2012
Source: Adapted from Statistics Canada, Custom Tabulation, Canadian Survey on Disability, 2012.
Percentages are rounded to the nearest one decimal point.
E use with caution.
Of people in Ontario who report a disability, almost one-third (30.9%) report a mental health or addiction disability, and 69.1% report another type of disability. The 30.9% includes 2.9% of people with disabilities who report that their sole disability type is a mental health or addiction disability (see Figure 2).
A slightly greater proportion of Ontarians (4.8%) report mental health and addiction disabilities compared to people across Canada (3.9%). Similarly, a slightly greater proportion of Ontarians report other disabilities (10.6%) compared to Canada (9.9%) (see Table 1).
Table 1. Prevalence of disability among adults aged 15 and older, Ontario and Canada, 2012
|
|
Ontario |
Canada |
||
|
Disability |
Number |
% |
Number |
% |
|
Mental/psychological disability |
510,280 |
4.8 |
1,059,600 |
3.9 |
|
Other disability
|
1,141,340 |
10.6 |
2,716,320 |
9.9 |
|
Total disability
|
1,651,620 |
15.4 |
3,775,910 |
13.7 |
|
No disability
|
9,076,280 |
84.6 |
23,740,290 |
86.3 |
Source: Adapted from Statistics Canada, Custom Tabulation, Canadian Survey on Disability, 2012.
Percentages are rounded to the nearest one decimal point.
E use with caution.
3.1.1. Multiple disabilities
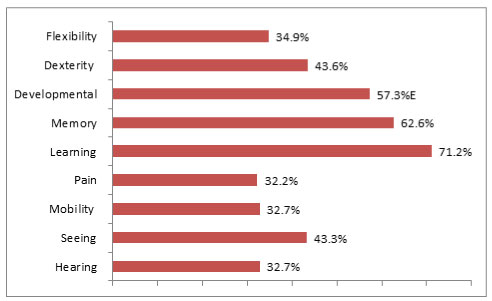
Figure 3. Prevalence of mental/psychological disabilities among adults aged 15 and older with other disability types, Ontario, 2012
Source: Adapted from Statistics Canada, Custom Tabulation, Canadian Survey on Disability, 2012; Statistics Canada, Canadian Survey on Disability, 2012, Data Tables, 2013, Statistic Canada Catalogue no. 89‑654‑X — No. 001
Percentages are rounded to the nearest one decimal point.
E use with caution. Note: Percentages do not total 100 due to people reporting multiple disabilities.
It is very common for people to have mental health and addiction disabilities along with other disabilities. The vast majority of Ontarians with mental health or addiction disabilities (90.5%) report another type of disability. This compares to 91.7% of people with mental health and addiction disabilities across Canada (see Table 2). More than 30% of people who have a hearing, seeing or other disability also report a mental health or addiction disability. People with learning (71.2%), memory (62.6%) and developmental disabilities (57.3%) are most likely to report mental health and addiction disabilities (see Figure 3 and Table 3).
Table 2. Prevalence of co-occurring disabilities among adults aged 15 and over, Ontario and Canada, 2012
|
|
Ontario |
Canada |
||
|
Disability type |
Number |
% |
Number |
% |
|
Mental/psychological disability only |
48,650E
|
9.5E |
87,640
|
8.3
|
|
Mental/psychological disability with other disability |
461,630
|
90.5
|
971,960
|
91.7
|
Source: Adapted from Statistics Canada, Custom Tabulation, Canadian Survey on Disability, 2012; Statistics Canada, Canadian Survey on Disability, 2012, Data Tables, 2013, Catalogue no. 89‑654‑X — No. 001
Percentages are rounded to the nearest one decimal point.
E use with caution.
Table 3. Prevalence of disability among adults with disabilities aged 15 and older by disability type and co-occurring mental/psychological disability, Ontario, 2012
|
|
Prevalence |
Prevalence with mental/psychological disability |
||
|
Type of disability
|
Number |
%* |
Number |
%** |
|
Total population with disabilities |
1,651,620 |
|
510,280 |
|
|
Flexibility disability |
971,630 |
58.8 |
338,820 |
34.9 |
|
Dexterity disability |
450,940 |
27.3 |
196,390 |
43.6 |
|
Developmental disability |
73,040 |
4.4 |
41,860E |
57.3E |
|
Memory disability |
303,140 |
18.4 |
189,780 |
62.6 |
|
Learning disability |
283,980 |
17.2 |
202,170 |
71.2 |
|
Pain disability |
1,191,230 |
72.1 |
383,650 |
32.2 |
|
Mobility disability |
857,690 |
51.9 |
280,360 |
32.7 |
|
Seeing disability |
331,930 |
20.1 |
143,600 |
43.3 |
|
Hearing disability |
391,100 |
23.7 |
127,920 |
32.7 |
Source: Adapted from Statistics Canada, Custom Tabulation, Canadian Survey on Disability, 2012; Statistics Canada, Canadian Survey on Disability, 2012, Data Tables, 2013, Catalogue no. 89‑654‑X — No. 001
Percentages are rounded to the nearest one decimal point.
E use with caution. Note: Percentages do not total 100 due to people reporting multiple disabilities.
* This column represents people with each disability type as a proportion of the total population with disabilities (including mental/psychological disabilities).
** This column represents the percentage of people with each disability type (hearing, etc.) who also have a mental/psychological disability.
3.1.2. Severity of disability
People whose disabilities are more severe have higher unemployment rates, are more likely to be prevented from looking for work due to disability, and are less likely to take part in civic life and social activities, compared to people with milder disabilities. They are more likely to need supports such as workplace accommodation, medical professionals, tend to spend more money on health visits, and are more likely to need assistive devices.[16] Overall, people with more severe disabilities face greater barriers to participation than people without disabilities and people with less severe disabilities.
When calculating the severity of people’s disabilities, Statistics Canada uses a global severity “score,” based on the average severity of all disability types. Overall, the global severity score:
- Increases with the number of disability types
- Increases with the level of difficulty associated with the disability
- Increases with the frequency of the activity limitation.[17]
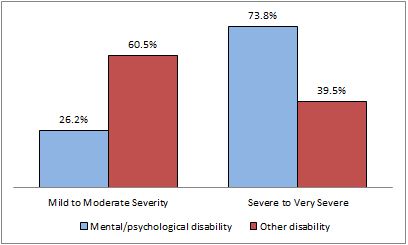
In Ontario, a much greater proportion of people with mental health and addiction disabilities have a severe or very severe disability (73.8%) compared to people with other disabilities (39.5%) (see Figure 4).
Figure 4. Severity of disability among adults aged 15 and older by disability type and severity level, Ontario, 2012
Source: Adapted from Statistics Canada, Custom Tabulation, Canadian Survey on Disability, 2012.
Percentages are rounded to the nearest one decimal point.
E use with caution.
Table 4. Severity of disability among adults aged 15 and older by disability type and severity level, Ontario and Canada, 2012
|
|
Ontario |
Canada |
||||||
|
Disability |
Mental/psychological |
Other disability |
Mental/psychological |
Other disability |
||||
|
Severity level |
Number |
% |
Number |
% |
Number |
% |
Number |
% |
|
Mild to moderate |
133,480 |
26.2 |
690,250 |
60.5 |
292,040 |
27.6 |
1,651,520 |
60.8 |
|
Severe to very severe |
376,810 |
73.8 |
451,080 |
39.5 |
767,560 |
72.4 |
1,064,800 |
39.2 |
Source: Adapted from Statistics Canada, Custom Tabulation, Canadian Survey on Disability, 2012
Percentages are rounded to the nearest one decimal point.
E use with caution.
3.2. Prevalence of disability and other intersecting Code grounds
The OHRC examined the reported incidence of mental health and addiction disabilities among Ontarians who identify with other Code grounds. In Minds that Matter, the OHRC heard that people who have a mental health disability or addiction and are from other marginalized communities (such as women, racialized or Indigenous peoples, gay, lesbian or bisexual people, and trans people) face unique and distinct forms of discrimination, called “intersectional discrimination.” Similarly, the OHRC heard that people from marginalized Code-protected groups are more likely than others to develop mental health and addiction disabilities, in part due to discrimination.
The demographic groups analyzed relate to the Code grounds of sex, age, race and related grounds such as place of origin, ethnic origin and ancestry, as well as marital status and family status.
3.2.1. Sex
Table 5. Prevalence of disability among adults aged 15 and older by disability type and sex, Ontario and Canada, 2012
|
|
Ontario |
Canada |
||||||
|
Sex |
Women |
Men |
Women |
Men |
||||
|
Disability |
Number |
% |
Number |
% |
Number |
% |
Number |
% |
|
Mental/ |
271,810 |
5 |
238,470 |
4.5 |
595,060 |
4.3 |
464,540 |
3.4 |
|
Other disability
|
647,740 |
11.8 |
493,600 |
9.4 |
1,481,830 |
10.6 |
1,234,480 |
9.1 |
Source: Adapted from Statistics Canada, Custom Tabulation, Canadian Survey on Disability, 2012.
Percentages are rounded to the nearest one decimal point.
E use with caution.
A slightly greater proportion of women aged 15 and older in Ontario report a mental health and addiction disability (5%) compared to men (4.5%). A greater proportion of women in Ontario report having other disabilities (11.8%) than men (9.4%).
A slightly greater proportion of women in Ontario report mental health and addiction disabilities (5%) than women in Canada (4.3%). A slightly greater proportion of men in Ontario (4.5%) report mental health and addiction disabilities compared to men across Canada (3.4%).
This result is similar for people with other disabilities. Greater proportions of men (9.4%) and women (11.8%) in Ontario report other disabilities compared to men (9.1%) and women (10.6%) across Canada.
3.2.2. Age
Figure 5. Age distribution among adults, aged 15 and older, by disability status, Ontario, 2012
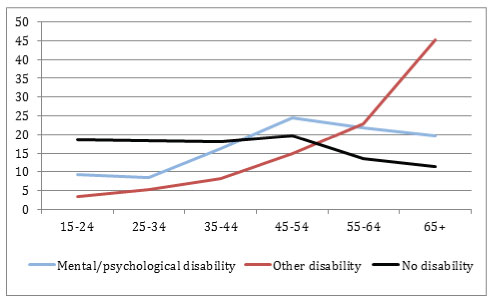
Source: Adapted from Statistics Canada, Custom Tabulation, Canadian Survey on Disability, 2012.
Percentages are rounded to the nearest one decimal point.
E use with caution.
A greater proportion of people with mental health and addiction disabilities are younger (15-34 years – 17.7%) and in mid-life (35-54 years – 40.6%) compared to people with other disabilities (8.8% and 23% respectively). People aged 15-24 account for 9.3% of all Ontarians who report mental health and addiction disabilities, more than twice the proportion of people with other disabilities (3.5%) (see Table 6).
Table 6. Age distribution among adults, aged 15 and older by disability status, Ontario, 2012
|
|
Ontario |
|||||
|
Disability status |
Mental/psychological |
Other disability |
No disability |
|||
|
Age |
Number |
% |
Number |
% |
Number |
% |
|
15-24 |
47,390E |
9.3E |
40,310 |
3.5 |
1,694,450 |
18.7 |
|
25-34 |
42,940 |
8.4 |
60,210 |
5.3 |
1,673,510 |
18.4 |
|
35-44 |
82,090 |
16.1 |
92,140 |
8.1 |
1,649,680 |
18.2 |
|
45-54 |
125,180 |
24.5 |
170,340 |
14.9 |
1,782,250 |
19.6 |
|
55-64 |
111,870 |
21.9 |
262,620 |
23 |
1,230,930 |
13.6 |
|
65+ |
100,810 |
19.8 |
515,720 |
45.2 |
1,045,460 |
11.5 |
Source: Adapted from Statistics Canada, Custom Tabulation, Canadian Survey on Disability, 2012.
Percentages are rounded to the nearest one decimal point.
E use with caution.
3.2.3. Indigenous peoples
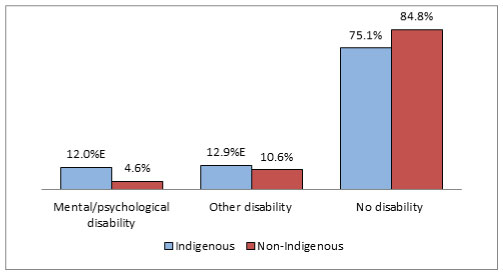
Figure 6. Prevalence of disability among adults aged 15 and older by Indigenous identity and disability status, Ontario, 2011
Source: Adapted from Statistics Canada, Custom Tabulation, Canadian Survey on Disability, 2012.
Percentages are rounded to the nearest one decimal point.
E use with caution.
Overall, the proportion of Indigenous peoples[18] in Ontario living off reserve who report any kind of disability (24.9%) is greater than the proportion of non-Indigenous people who report disabilities (15.2%) and the proportion of Indigenous peoples across Canada who report disabilities (18.6%).
In Ontario, 12% of Indigenous peoples aged 15 and over living off reserve report a mental health or addiction disability, compared to 4.6% of people who are not Indigenous. A greater proportion of Indigenous peoples in Ontario (12%) report mental health and addiction disabilities compared to across Canada (6.6%).
Table 7. Prevalence of disability among adults aged 15 and older by Indigenous identity and disability type, Ontario and Canada, 2011
|
|
Ontario |
Canada |
||||||
|
Identity |
Indigenous |
Non-Indigenous |
Indigenous |
Non-Indigenous |
||||
|
Disability |
Number |
% |
Number |
% |
Number |
% |
Number |
% |
|
Mental/ psychological disability
|
22,360E |
12.0E |
487,920 |
4.6 |
52,330 |
6.6 |
1,007,270 |
3.8 |
|
Other disability |
24,040E |
12.9E |
1,117,300 |
10.6
|
94,580 |
12.0 |
2,621,260 |
9.8 |
|
Total disability
|
46,400E |
24.9E |
1,605,220 |
15.2 |
146,900 |
18.6 |
3,628,530 |
13.6 |
|
No disability |
140,270
|
75.1 |
8,936,020 |
84.8 |
643,460 |
81.4 |
23,096,830 |
86.4 |
Source: Adapted from Statistics Canada, Custom Tabulation, Canadian Survey on Disability, 2012.
Percentages are rounded to the nearest one decimal point.
E use with caution.
3.2.4. Racialized people
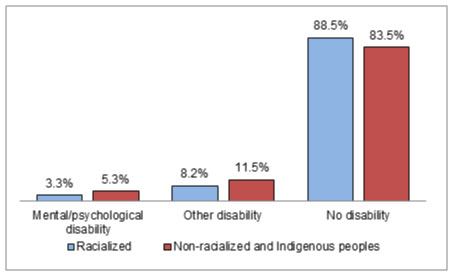
Figure 7. Prevalence of disability among adults aged 15 and older by racialized identity and disability status, Ontario, 2011
Source: Adapted from Statistics Canada, Custom Tabulation, Canadian Survey on Disability, 2012.
Percentages are rounded to the nearest one decimal point.
E use with caution.
The racialized population[19] may be associated with the Code grounds of race, ethnic origin, colour and place of origin. The data on the racialized population in this report uses Statistics Canada’s variable for the “visible minority” population.[20] Statistics Canada does not include Indigenous peoples as “visible minorities.”
In Ontario, a smaller proportion of racialized people (3.3%) report mental health and addiction disabilities than indigenous peoples and non-racialized people (5.3% combined). The same can be observed for other types of disabilities (8.2% versus 11.5%).
A slightly greater proportion of racialized people in Ontario report mental health and addiction disabilities (3.3%) compared to Canada (2.7%) - See Table 8.
Table 8. Prevalence of disability among adults aged 15 and older by racialized identity and disability status, Ontario and Canada, 2011
|
|
Ontario |
Canada |
||||||
|
Identity |
Racialized people |
Non-racialized people and Indigenous peoples |
Racialized people |
Non-racialized people and Indigenous peoples |
||||
|
Disability |
Number |
% |
Number |
% |
Number |
% |
Number |
% |
|
Mental/ psychological disability |
87,920 |
3.3 |
422,360 |
5.3 |
139,570 |
2.7 |
920,030 |
4.1 |
|
Other disability |
221,530 |
8.2 |
919,810 |
11.5 |
369,410 |
7.3 |
2,346,420 |
10.5 |
|
No disability
|
2,385,260 |
88.5 |
6,691,020 |
83.3 |
4,577,520 |
90 |
19,162,770 |
85.4 |
Source: Adapted from Statistics Canada, Custom Tabulation, Canadian Survey on Disability, 2012.
Percentages are rounded to the nearest one decimal point.
E use with caution.
3.2.5. Marital status
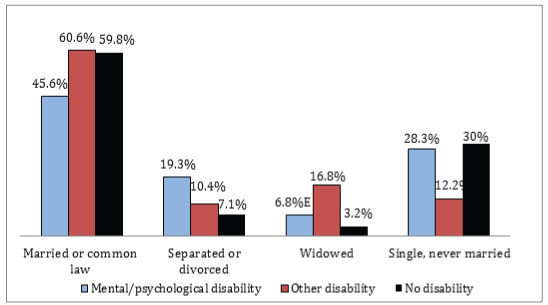
Figure 8. Marital status of adults aged 15 and older by marital status category and disability status, Ontario, 2011
Source: Adapted from Statistics Canada, Custom Tabulation, Canadian Survey on Disability, 2012.
Percentages are rounded to the nearest one decimal point.
E use with caution. Notes: Missing values are included. Percentages do not total 100.
The proportion of people with mental health and addiction disabilities who are single and never married (28.3%) is similar to people without disabilities (30%). A much smaller proportion of people with other disabilities are single or never married (12.2%) compared to these groups. However, a greater proportion of people with mental health and addiction disabilities are separated or divorced (19.3%) compared to people with other disabilities (10.4%) and people without disabilities (7.1%).
A smaller proportion of people with mental health or addiction disabilities in Ontario are married or in a common-law relationship (45.6% for both categories) than people with other disabilities (60.6%) or people without disabilities (59.8%).
People with other disabilities represent the greatest proportion of people who are married or in common-law relationships (60.6% for both categories) or are widowed (16.8%). As noted in the section on age, people who have other disabilities are often older people, which may account for a greater proportion of this group being widowed.
Table 9. Marital status of adults aged 15 and older by marital status category and disability status, Ontario, 2011
|
|
Ontario |
|||||
|
Disability |
Mental/psychological disability |
Other disability |
No disability |
|||
|
Marital status |
Number |
% |
Number |
% |
Number |
% |
|
Married and not separated |
203,090
|
39.8
|
630,380
|
55.2
|
4,715,550
|
52
|
|
Common-law |
29,710E |
5.8E |
61,230 |
5.4 |
710,370 |
7.8
|
|
Separated but still legally married or divorced |
98,330 |
19.3 |
119,120 |
10.4 |
640,340 |
7.1 |
|
Widowed
|
34,600E |
6.8E |
191,380 |
16.8 |
285,950 |
3.2 |
|
Single, never married
|
144,550 |
28.3 |
139,230 |
12.2 |
2,724,080 |
30 |
Source: Adapted from Statistics Canada, Custom Tabulation, Canadian Survey on Disability, 2012.
Percentages are rounded to the nearest one decimal point.
E use with caution. Notes: Missing values are included. Percentages do not add total 100.
3.2.6. Families
Figure 9. Family composition of adults aged 15 and older by disability status and presence of children, Ontario, 2011
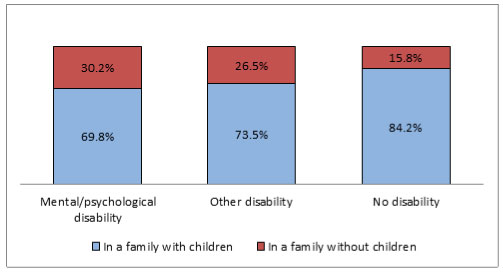
Source: Adapted from Statistics Canada, Custom Tabulation, Canadian Survey on Disability, 2012.
Percentages are rounded to the nearest one decimal point.
E use with caution. Note: Missing values are included.
A greater proportion of people with mental health and addiction disabilities in Ontario, aged 15 and older, live in families without children (30.2%), than people with other types of disabilities (26.5%) and people without disabilities (15.8%).
A slightly higher proportion of people with mental health and addiction disabilities in Ontario live in families with children[21] (69.8%) than across Canada (67.7%). This is similar for people with other disabilities (73.5% in Ontario versus 72.2% across Canada) (see Table 10).
Table 10. Family composition of adults aged 15 and over by disability status and presence of children, Ontario and Canada, 2011
|
|
Ontario |
Canada |
||||||
|
Presence of |
In a family with children |
In a family without children |
In a family with children |
In a family without children |
||||
|
Disability |
Number |
% |
Number |
% |
Number |
% |
Number |
% |
|
Mental/ psychological disability |
356,140
|
69.8
|
154,150
|
30.2
|
717,020
|
67.7
|
342,580
|
32.3
|
|
Other disability |
838,680
|
73.5
|
302,650
|
26.5
|
1,960,390
|
72.2
|
755,440
|
27.8
|
|
No disability |
7,642,000
|
84.2
|
1,434,280
|
15.8
|
19,518,290
|
82.2
|
4,222,000
|
17.8
|
Source: Adapted from Statistics Canada, Custom Tabulation, Canadian Survey on Disability, 2012.
Percentages are rounded to the nearest one decimal point.
E use with caution. Note: Missing values are included. Percentages do not total 100.
3.2.7. People in the household
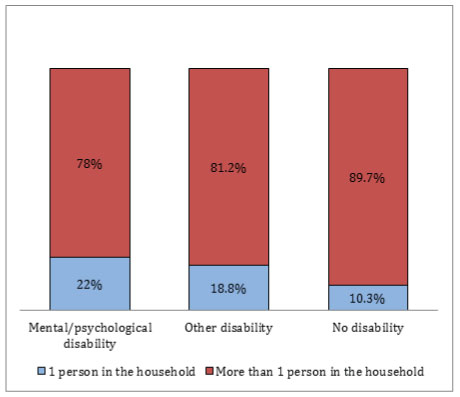
Figure 10. Household composition of adults aged 15 and oolder by disability status and number of persons, Ontario, 2011
Source: Adapted from Statistics Canada, Custom Tabulation, Canadian Survey on Disability, 2012.
Percentages are rounded to the nearest one decimal point.
E use with caution. Note: Missing values are included.
A greater proportion of people with mental health and addiction disabilities in Ontario aged 15 and over live alone (22%) than people with other types of disabilities (18.8%) and people without disabilities (10.3%). The proportion of people with mental health and addiction disabilities who live alone in Ontario (22%) is slightly smaller than across Canada (24%).
Table 11. Household composition of adults aged 15 and older by disability status and number of persons, Ontario and Canada, 2011
|
|
Ontario |
Canada |
||||||
|
Numner of |
One person households |
Households with more than one person |
One person households |
Households with more than one person |
||||
|
Disability |
Number |
% |
Number |
% |
Number |
% |
Number |
% |
|
Mental/ psychological disability |
112,490 |
22 |
397,790 |
78 |
254,150 |
24 |
805,440 |
76 |
|
Other disability |
214,040 |
18.8 |
927,300 |
81.2 |
567,590 |
20.9 |
2,148,240 |
79.1 |
|
No disability
|
936,700 |
10.3 |
8,139,580 |
89.7 |
2,842,320 |
12 |
20,897,980 |
88 |
Source: Adapted from Statistics Canada, Custom Tabulation, Canadian Survey on Disability, 2012.
Percentages are rounded to the nearest one decimal point.
E use with caution. Note: Missing values are included.
3.3. Housing
Affordable and adequate housing is a necessity for everyone in Ontario and across Canada. The international community has long recognized that housing is a fundamental and universal human right, through international treaties such as the International Covenant on Economic, Social and Cultural Rights (ICESCR), which Canada has ratified. The Convention on the Rights of Persons with Disabilities (CRPD) also outlines the rights of people with disabilities to an adequate standard of living and social protection, which includes the right to housing (Article 28).
Looking at how many people lack housing that is adequate, affordable and suitable is another way to assess social and economic disparities between people with disabilities and people without disabilities.
This section examines four aspects of housing:
- Housing tenure (owned or rented)
- Core housing need
- Dwelling structure
- Number of bedrooms.
3.3.1. Housing tenure
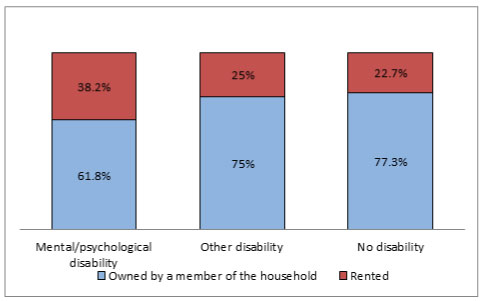
Figure 11. Housing tenure of adults aged 15 and older by disability status and type of tenure Ontario, 2011
Source: Adapted from Statistics Canada, Custom Tabulation, Canadian Survey on Disability, 2012.
Percentages are rounded to the nearest one decimal point.
E use with caution. Note: “Other” and “not specified” responses are excluded.
In Ontario, a greater proportion of people with mental health or addiction disabilities aged 15 and oolder live in rented housing (38.2%) compared to people with other disabilities (25%) and people without disabilities (22.7%).
Table 12. Housing tenure of adults aged 15 and older by disability status and type of tenure, Ontario and Canada, 2011
|
|
Ontario |
Canada |
||||||
|
Type of |
Owned by a member of the household |
Rented |
Owned by a member of the household |
Rented |
||||
|
Disability |
Number |
% |
Number |
% |
Number |
% |
Number |
% |
|
Mental/ psychological disability |
315,320 |
61.8 |
194,970 |
38.2 |
647,420 |
61.1 |
412,120 |
38.9 |
|
Other disability |
856,470 |
75 |
284,870 |
25 |
2,017,080 |
74.3 |
698,610 |
25.7 |
|
No disability |
7,018,540 |
77.3 |
2,057,690 |
22.7 |
17,843,500 |
75.2 |
5,894,880 |
24.8 |
Source: Adapted from Statistics Canada, Custom Tabulation, Canadian Survey on Disability, 2012.
Percentages are rounded to the nearest one decimal point.
E use with caution. Note: “Other” and “not specified” responses excluded.
3.3.2. Core housing need
The Canada Mortgage and Housing Corporation (CMHC) uses the concept of “core housing need,” which is made up of the following elements:
- Adequacy: the physical condition of the dwelling (e.g. whether housing is in need of major repairs)
- Suitability: whether the housing is of a suitable size and has enough bedrooms for the size and make-up of the household
- Affordability: whether it costs less than 30% of before-tax household income.
If a household cannot meet one of these standards, and is “unable to pay the median rent for alternative local housing meeting all standards without spending 30% or more of its before-tax income,” it is considered to be in core housing need.[22]
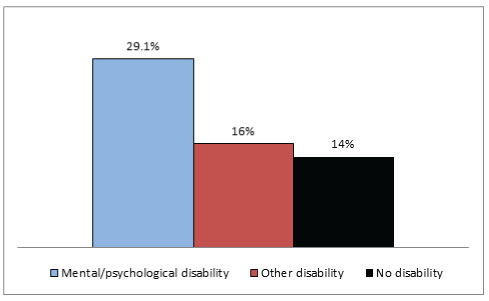
Figure 12. Core housing need of adults aged 15 and older by disability status, Ontario, 2006
Source: Adapted from Statistics Canada, Custom Tabulation, Participation and Activity Limitation Survey, 2006.
Percentages are rounded to the nearest one decimal point.
E use with caution. Note: Not stated/not applicable responses excluded.
In 2006, the proportion of Ontarians with mental health or addiction disabilities[23] who were in “core housing need” (29.1%) was more than twice that of people without disabilities (14%). People with other disabilities (16%) were somewhat more likely than people without disabilities (14%) to be in core housing need.
Table 13. Core housing need of adults aged 15 and over by disability status, Ontario and Canada, 2006
|
|
Ontario |
Canada |
||
|
Disability status |
Number |
% |
Number |
% |
|
Mental/ psychological disability |
77,470
|
29.1
|
177,510
|
30.1
|
|
Other disability |
240,950 |
16 |
565,500 |
15.5 |
|
No disability
|
1,122,040
|
14
|
2,446,060
|
11.5
|
Source: Adapted from Statistics Canada, Custom Tabulation, Participation and Activity Limitation Survey, 2006.
E use with caution.
Percentages are rounded to the nearest one decimal point. Note: “Not stated”/”not applicable” responses are excluded.
3.3.3. Dwelling structure
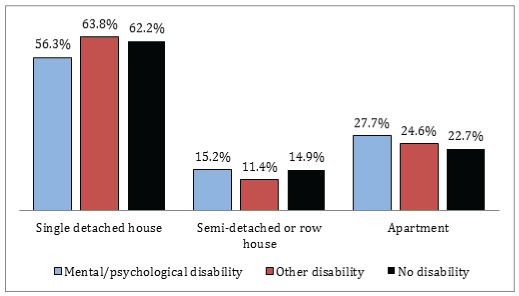
Figure 13. Adults, aged 15 and older by dwelling structure and disabilty status, Ontario, 2011
Source: Adapted from Statistics Canada, Custom Tabulation, Canadian Survey on Disability, 2012.
Percentages are rounded to the nearest one decimal point.
E use with caution.
Most people in Ontario live in single detached houses. However, a greater proportion of people with mental health or addiction disabilities in Ontario live in apartments (27.7%) compared to people with other disabilities (24.6%) and people without disabilities (22.7%).
At the national level, a greater proportion of people with mental health and addiction disabilities live in apartments than in Ontario (32.3% for Canada, 27.7% for Ontario) (see Tables 14 and 15).
Table 14. Adults, aged 15 and over by dwelling structure and disabilty status, Ontario, 2011
|
|
Ontario |
|||||
|
Disability |
Mental/psychological |
Other disability |
No disability |
|||
|
Dwelling structure |
Number |
% |
Number |
% |
Number |
% |
|
Single detached house |
287,540 |
56.3 |
727,860 |
63.8 |
5,641,080 |
62.2 |
|
Semi-detached |
77,550 |
15.2 |
130,630 |
11.4 |
1,352,740 |
14.9 |
|
Apartment
|
141,250 |
27.7 |
281,000 |
24.6 |
2,056,750 |
22.7 |
|
Other dwelling[24]
|
F |
F |
F |
F |
25,720 |
0.3 |
Source: Adapted from Statistics Canada, Custom Tabulation, Canadian Survey on Disability, 2012.
Percentages are rounded to the nearest one decimal point.
E use with caution.
F data supressed due to confidentiality. Note: “Not specified” responses are excluded.
Table 15. Adults, aged 15 and older by dwelling structure and disability status, Canada, 2011
|
|
Canada |
|||||
|
Disability |
Mental/psychological |
Other disability |
No disability |
|||
|
Dwelling structure |
Number |
% |
Number |
% |
Number |
% |
|
Single detached house |
565,620 |
53.4 |
1,675,870 |
61.7 |
14,685,570 |
61.9 |
|
Semi-detached or row house |
131,510 |
12.4 |
259,550 |
9.6 |
2,699,580 |
11.4 |
|
Apartment
|
341,960 |
32.3 |
733,790 |
27 |
6,075,720 |
25.6 |
|
Other dwelling
|
20,060E |
1.9E |
44,870 |
1.7 |
274,660 |
1.2 |
Source: Adapted from Statistics Canada, Custom Tabulation, Canadian Survey on Disability, 2012.
Percentages are rounded to the nearest one decimal point.
E use with caution. Note: “Not specified” responses are excluded.
3.3.4. Number of bedrooms
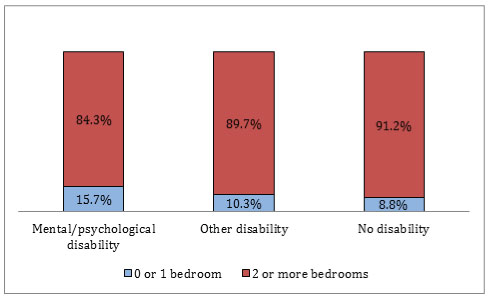
Figure 14. Adults, aged 15 and older by number of bedrooms and disabilty status, Ontario 2011
Source: Adapted from Statistics Canada, Custom Tabulation, Canadian Survey on Disability, 2012.
Percentages are rounded to the nearest one decimal point.
E use with caution.
A greater proportion of Ontarians with mental health and addiction disabilities, aged 15 and older, live in households that either have zero bedrooms (e.g. studio apartments) or one bedroom (15.7%) compared to people with other disabilities (10.3%) and people without disabilities (8.8%). Nationwide, a slightly higher proportion of people with mental health and addiction disabilities (17.4%) live in studio or one-bedroom apartments than in Ontario (15.7%) - See Tables 16 and 17.
Table 16. Adults, aged 15 and older by number of bedrooms and disabilty status, Ontario 2011
|
|
Ontario |
|||||
|
Disability |
Mental/psychological |
Other disability |
No disability |
|||
|
Number of |
Number |
% |
Number |
% |
Number |
% |
|
0 or 1 bedroom |
79,880 |
15.7 |
117,450 |
10.3 |
803,070 |
8.8 |
|
2 bedrooms
|
98,060 |
19.2 |
261,240 |
22.9 |
1,528,810 |
16.8 |
|
3 bedrooms
|
190,250 |
37.3 |
461,750 |
40.5 |
3,675,280 |
40.5 |
|
4 bedrooms
|
118,160 |
23.2 |
229,710 |
20.1 |
2,370,490 |
26.1 |
|
5 or more bedrooms |
23,930E |
4.7E |
71,190 |
6.2 |
698,640 |
7.7 |
Source: Adapted from Statistics Canada, Custom Tabulation, Canadian Survey on Disability, 2012.
Percentages are rounded to the nearest one decimal point.
E use with caution.
Table 17. Adults, aged 15 and older by number of bedrooms and disabilty status, Canada, 2011
|
|
Canada |
|||||
|
Disability |
Mental/psychological |
Other disability |
No disability |
|||
|
Number of |
Number |
% |
Number |
% |
Number |
% |
|
0 or 1 bedroom |
184,850 |
17.4 |
303,260 |
11.2 |
2,174,150 |
9.2 |
|
2 bedrooms
|
236,310 |
22.3 |
697,510 |
25.7 |
4,754,170 |
20 |
|
3 bedrooms
|
359,780 |
34 |
1,012,350 |
37.3 |
9,112,960 |
38.4 |
|
4 bedrooms
|
213,790 |
20.2 |
504,560 |
18.6 |
5,604,180 |
23.6 |
|
5 or more bedrooms |
64,870 |
6.1 |
198,150 |
7.3 |
2,094,820 |
8.8 |
Source: Adapted from Statistics Canada, Custom Tabulation, Canadian Survey on Disability, 2012.
Percentages are rounded to the nearest one decimal point.
E use with caution.
3.4. Education
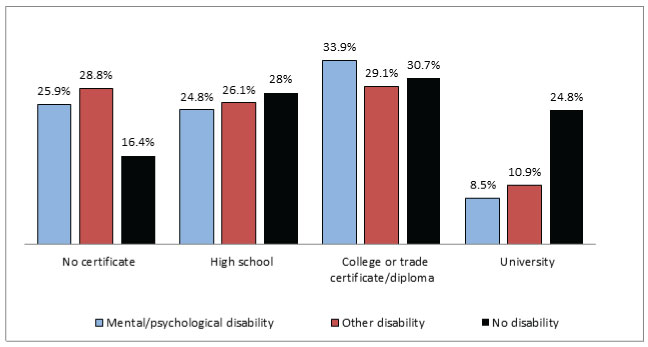
Figure 15. Educational attainment of adults aged 15 and older by highest level of education and disability status, Ontario, 2011
Source: Adapted from Statistics Canada, Custom Tabulation, Canadian Survey on Disability, 2012.
Percentages are rounded to the nearest one decimal point.
E use with caution. Note: These figures exclude institutional residents and survey respondents who did not state their highest level of education. Missing values are included. “Not specified” values are excluded from the graph.
Achieving education potential affects a person’s ability to take part in the labour market and their earning potential. Having post-secondary education is becoming increasingly important. Employment and Social Development Canada projects that two-thirds of job openings from 2011-2020 will be in occupations that generally require post-secondary education (college, university or vocational), or management occupations.[25]
Yet, over a quarter of Ontarians with mental health and addiction disabilities (25.9%) have no high school. This proportion is lower than that of people with other disabilities (28.8%) but substantially higher compared to people without disabilities (16.4%). At the national level, a slightly greater proportion of people with mental health and addiction disabilities have not completed high school (27.8%) compared to Ontario (25.9%).
The proportion of Ontarians without disabilities with a university degree (24.8%) is more than twice that of people with mental health and addiction disabilities (8.5%) or people with other disabilities (10.9%).
Ontarians with mental health and addiction disabilities are four times more likely to earn a college diploma or trade certificate (33.9%) than complete university (8.5%). For people with other disabilities, the proportion who earned a college diploma or trade certificate (29.1%) is more than twice that of the proportion who completed university (10.9%).
In Ontario, a greater proportion of people with mental health and addiction disabilities earned a college diploma or a trade certificate as their highest educational achievement (33.9%) than people with other disabilities (29.1%) and people with no disabilities (30.7%).
Almost a quarter of people in Ontario with mental health and addiction disabilities have discontinued their formal education or training because of their condition (24.1%). This is more than three times higher than the proportion of people with other disabilities who have discontinued their education because of their condition (6.4%) (see Table 20).
Table 18. Educational attainment of adults aged 15 and older by highest level of education and disability status, Ontario, 2011
|
|
Ontario |
|||||
|
Disability |
Mental/psychological |
Other disability |
No disability |
|||
|
Highest level of education |
Number |
% |
Number |
% |
Number |
% |
|
No certificate |
132,310 |
25.9 |
329,180 |
28.8 |
1,490,620 |
16.4 |
|
High school |
126,670 |
24.8 |
297,400 |
26.1 |
2,545,350 |
28 |
|
College diploma or trade certificate |
172,920 |
33.9 |
331,800 |
29.1 |
2,784,740 |
30.7 |
|
University |
43,480 |
8.5 |
124,770 |
10.9 |
2,248,650 |
24.8 |
Source: Adapted from Statistics Canada, Custom Tabulation, Canadian Survey on Disability, 2012.
Percentages are rounded to the nearest one decimal point.
E use with caution. Notes: These figures exclude institutional residents and survey respondents who did not state their highest level of education. Missing values are included. “Not specified” values are excluded from the table.
Table 19. Educational attainment of adults aged 15 and older by highest level of education and disability status, Canada, 2011
|
|
Canada |
|||||
|
Disability |
Mental/psychological |
Other disability |
No disability |
|||
|
Highest level of education |
Number |
% |
Number |
% |
Number |
% |
|
No certificate
|
294,570 |
27.8 |
792,840 |
29.2 |
4,214,960 |
17.8 |
|
High school
|
275,200 |
26 |
645,320 |
23.8 |
6,256,530 |
26.4 |
|
College diploma or trade certificate |
332,500 |
31.4 |
859,720 |
31.7 |
8,012,690 |
33.8 |
|
University
|
95,380 |
9 |
287,960 |
10.6 |
5,238,710 |
22.1 |
Source: Adapted from Statistics Canada, Custom Tabulation, Canadian Survey on Disability, 2012.
Percentages are rounded to the nearest one decimal point.
E use with caution. Notes: These figures exclude institutional residents and survey respondents who did not state their highest level of education. Missing values are included. “Not specified” values are excluded from the table.
Table 20. Discontinuation of formal education due to disability of adults aged 15 and older, by disability type, Ontario and Canada, 2011
|
|
Ontario |
Canada |
||
|
Disability type |
Number |
% |
Number |
% |
|
Mental/ |
109,220
|
24.1
|
117,510
|
24.8
|
|
Other disability |
56,820
|
6.4
|
78,910
|
6.1
|
Source: Adapted from Statistics Canada, Custom Tabulation, Canadian Survey on Disability, 2012.
Percentages are rounded to the nearest one decimal point.
E use with caution.
3.5. Labour force
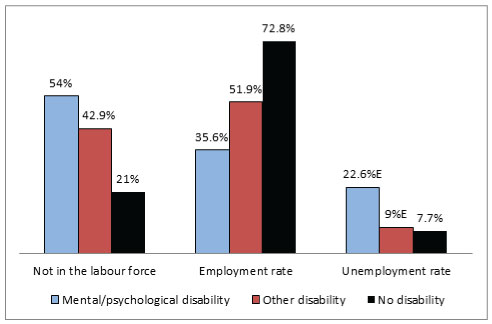
Figure 16. Labour force status of adults aged 15-64 by labour force category and disability status, Ontario, 2011
Source: Adapted from Statistics Canada, Custom Tabulation, Canadian Survey on Disability, 2012.
Percentages are rounded to the nearest one decimal point.
E use with caution. Notes: The totals represent the number of people in each category surveyed between the ages of 15-64. Percentages do not total 100.
Work can contribute to a person’s dignity, self-esteem and ability to take part in society. The United Nations’ Convention on the Rights of Persons with Disabilities recognizes the right of people with disabilities to work and the need for opportunities to make a living. Workplaces must be made inclusive and accessible to persons with disabilities. By ratifying the CRPD, Canada has agreed to take progressive steps to promote the right to work for people with disabilities.
This section examines three aspects of labour force data:
- The proportion of people not in the labour force
- The employment rate, and
- The unemployment rate.
3.5.1. Not in the labour force
In 2011 in Ontario, 54% of people with mental health and addiction disabilities between the ages of 15 and 64 (201,220 people) were not in the labour force, [26] compared to 42.9% of people with other disabilities and 21% for people without disabilities.
3.5.2. Employment rate
In 2011, the employment rate[27] of Ontarians aged 15-64 with mental health and addiction disabilities (35.6%) was much lower than for people with other disabilities (51.9%) and people without disabilities (72.8%).
The employment rate of people with mental health and addiction disabilities in Ontario was similar to the rate for this group across Canada (35.6% compared to 35.9%).
3.5.3. Unemployment rate
The unemployment rate[28] of Ontarians aged 15-64 with mental health or addiction disabilities in 2011 (22.6%) was more than twice as high as for Ontarians with other disabilities (9%), and almost three times higher than for Ontarians without disabilities (7.7%).
Table 21. Labour force status of adults aged 15-64 by disability status and labour force category, Ontario, 2011
|
|
Ontario |
||
|
Disability |
Mental/psychological |
Other disability |
No disability |
|
Labour force category |
% |
% |
% |
|
Not in the labour force
|
54 |
42.9 |
21 |
|
Employment rate
|
35.6 |
51.9 |
72.8 |
|
Unemployment rate
|
22.6E |
9E |
7.7 |
Source: Adapted from Statistics Canada, Custom Tabulation, Canadian Survey on Disability, 2012.
Percentages are rounded to the nearest one decimal point.
E use with caution. Note: Percentages do not total 100.
Table 22. Labour force status of adults aged 15-64 by disability status and labour force category, Canada, 2011
|
|
Canada |
||
|
Disbility |
Mental/psychological |
Other disability |
No disability |
|
Labour force status |
% |
% |
% |
|
Not in the labour force |
55.3 |
41.4 |
20.7 |
|
Employment rate |
35.9 |
53.5 |
73.6 |
|
Unemployment rate |
19.6E |
8.4 |
7.1 |
Source: Adapted from Statistics Canada, Custom Tabulation, Canadian Survey on Disability, 2012.
Percentages are rounded to the nearest one decimal point.
E use with caution. Note: Percentages do not total 100.
3.6. Discrimination at work
The Code prohibits discrimination in employment based on disability. Despite this protection, in the OHRC’s mental health consultation, participants identified workplace discrimination as a significant concern. Many people described being treated inequitably on the job, being dismissed, harassed or exposed to a poisoned environment, based on their mental health or addiction disabilities. The OHRC heard that many people did not receive the disability-related accommodations they needed in the workplace. Many were reluctant to disclose their disability because of concerns about discrimination, or concerns that their performance would be judged based on their disability.[29]
This section presents data on two aspects of discrimination at work:
- Perception of discrimination
- Providing workplace accommodation.
3.6.1. Perception of discrimination
Figure 17. Perception of disability discrimination in the workplace among adults aged 15 and older by disability type and type of discrimination, Ontario, 2012
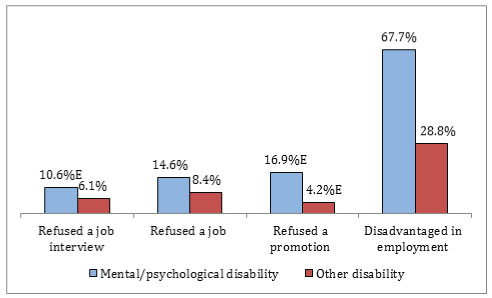
Source: Adapted from Statistics Canada, Custom Tabulation, Canadian Survey on Disability, 2012.
Percentages are rounded to the nearest one decimal point. Percentages do not total 100.
E use with caution. Note: Missing values are excluded.
The CSD asks if, in the last five years, people with disabilities believe that, because of their condition, they have been:
- Refused a job interview
- Refused a job
- Refused a promotion
- Disadvantaged in employment.
Many people with disabilities perceive they have been discriminated against in employment regardless of disability type. A substantially high proportion of people with mental health and addiction disabilities (67.7%) report being disadvantaged at work due to their condition. The same observation can be made when looking at Ontarians with mental health and addiction disabilities compared to people with mental health and addiction disabilities across Canada.
A higher proportion of Ontarians with mental health and addiction disabilities report workplace discrimination compared to Ontarians with other disabilities. This is seen across all types of workplace discrimination.
Table 23. Perception of disability discrimination in the workplace among adults aged 15 and older by disability type and type of discrimination, Ontario and Canada, 2012
|
|
Ontario |
Canada |
||||||
|
Disability |
Mental/psychological |
Other disability |
Mental/psychological |
Other disability |
||||
|
Type of discrimination |
Number |
% |
Number |
% |
Number |
% |
Number |
% |
|
Refused a |
25,610E |
10.6E |
30,060 |
6.1 |
63,690 |
12.5 |
69,860 |
5.7 |
|
Refused a job |
33,950 |
14.6 |
41,420 |
8.4 |
97,060 |
19.4 |
103,570 |
8.5 |
|
Refused a promotion |
39,630E |
16.9E |
20,890E |
4.2E |
74,540 |
14.8 |
61,610 |
5 |
|
Disadvantaged due to condition |
150,740 |
67.7 |
122,530 |
28.8 |
297,080 |
63.7 |
332,890 |
30.4 |
Source: Adapted from Statistics Canada, Custom Tabulation, Canadian Survey on Disability, 2012.
Percentages are rounded to the nearest one decimal point. Percentages do not total 100.
E use with caution. Note: Missing values are excluded.
3.6.2. Workplace accommodation
Figure 18. Workplace accommodation required and received by adults aged 15 and older by disability type, Ontario, 2012
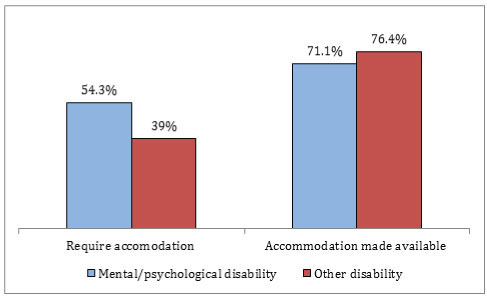
Source: Adapted from Statistics Canada, Custom Tabulation, Canadian Survey on Disability, 2012.
Percentages are rounded to the nearest one decimal point.
E use with caution. Note: Missing values are excluded.
In Ontario, more than half of people with mental health and addiction disabilities said they needed some type of accommodation to be able to work.[30] A greater proportion of people with mental health and addiction disabilities report that they require workplace accommodation (54.3%) than people with other disabilities (39%). Overall, over 70% of people with disabilities who requested accommodation received it. People with other disabilities were more likely to receive the accommodation requested (76.4%) than people with mental health and addiction disabilities (71.1%).
People with mental health disabilities or addictions in Ontario (71.1%) are slightly more likely to receive workplace accommodation than their counterparts across Canada (67.9%) (see Tables 24 and 25).
Table 24. Workplace accommodation required by adults aged 15 and older by disability type, Ontario and Canada, 2012
|
|
Ontario |
Canada |
||||||
|
Disability |
Mental/psychological |
Other disability |
Mental/psychological |
Other disability |
||||
|
|
Number |
% |
Number |
% |
Number |
% |
Number |
% |
|
Require accommodation
|
142,770 |
54.3 |
193,330 |
39 |
298,440 |
55.1 |
468,950 |
38.3 |
Source: Adapted from Statistics Canada, Custom Tabulation, Canadian Survey on Disability, 2012.
Percentages are rounded to the nearest one decimal point.
E use with caution. Note: Missing values are excluded.
Table 25. Workplace accommodation received by adults aged 15 and older by disability type, Ontario and Canada, 2012
|
|
Ontario |
Canada |
||||||
|
Disability |
Mental/psychological |
Other disability |
Mental/psychological |
Other disability |
||||
|
|
Number |
% |
Number |
% |
Number |
% |
Number |
% |
|
Accommodation
|
71,840 |
71.1
|
124,450 |
76.4 |
142,410 |
67.9 |
289,010 |
75.3 |
Source: Adapted from Statistics Canada, Custom Tabulation, Canadian Survey on Disability, 2012.
Percentages are rounded to the nearest one decimal point.
E use with caution. Note: Missing values are excluded.
3.7. Income
During its mental health consultation, the OHRC heard that poverty is a pressing concern for Ontarians with mental health disabilities and addictions. Participants explained how discrimination, such as in employment and education, can contribute to poverty. At the same time, the OHRC heard that living in poverty can negatively affect people’s physical and mental health by contributing to people’s exclusion from society. The CRPD recognizes that people with disabilities tend to live in poverty. Article 28 outlines the right to an adequate standard of living and social protection, including food, clothing and housing, without discrimination because of disability.
This section looks at income levels and low-income status as indicators of economic inequality.
3.7.1. Income levels
Figure 19. Median income of adults aged 15 and older by income type and disability status, Ontario, 2010
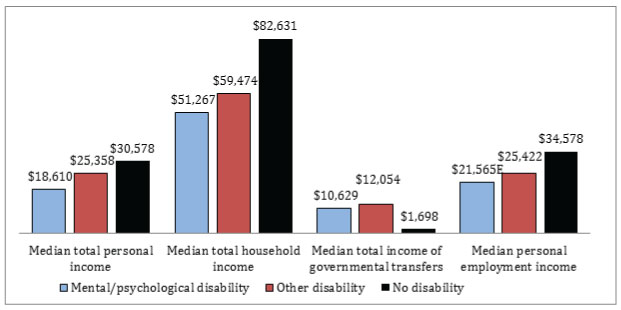
Source: Adapted from Statistics Canada, Custom Tabulation, Canadian Survey on Disability, 2012.
Percentages are rounded to the nearest one decimal point.
E use with caution.
With the exception of income from governmental transfers, Ontarians with mental health and addiction disabilities have a lower median income than people without disabilities.
In 2010, the median[31] personal income (from all income sources[32]) of people with mental health and addiction disabilities in Ontario was 39% lower than that of people without disabilities ($18,610 versus $30,578).[33]
The median income of households[34] where someone had a mental health or addiction disability ($51,267) was 38% lower than the median total income of households where members did not have disabilities ($82,631).
Ontarians with mental health and addiction disabilities received much more government income[35] (median was $10,629) than people without disabilities in 2010 (median was $1,698).
People with mental health and addiction disabilities also had 38% less income from employment[36] than people without disabilities (median was $21,565 versus median of $34,578).
Table 26. Median income of adults aged 15 and older by income type and disability status, Ontario, 2010
|
|
Ontario |
||
|
Disability |
Mental/psychological |
Other disability |
No disability |
|
Income type |
Amount ($) |
Amount ($) |
Amount ($) |
|
Median total personal income |
18,610 |
25,358** |
30,578 |
|
Median total household income |
51,267 |
59,474** |
82,631 |
|
Median total government income |
10,629 |
12,054** |
1,698 |
|
Median personal employment income |
21,565E |
25,422** |
34,578 |
Source: Adapted from Statistics Canada, Custom Tabulation, Canadian Survey on Disability, 2012.
Percentages are rounded to the nearest one decimal point.
E use with caution. ** comparisons between people with other disabilities and people with mental health and addiction disabilities are not significant.
Table 27. Median income of adults aged 15 and older by income type and disability status, Canada, 2010
|
|
Canada |
||
|
Disability |
Mental/psychological |
Other disability |
No disability |
|
Income type |
Amount ($) |
Amount ($) |
Amount ($) |
|
Median total personal income |
17,744 |
23,864 |
30,253
|
|
Median total household income |
49,103 |
55,489 |
77,890
|
|
Median total government income |
10,449 |
12,363 |
2,776 |
|
Median personal employment income |
18,720 |
25,432 |
33,379 |
Source: Adapted from Statistics Canada, Custom Tabulation, Canadian Survey on Disability, 2012.
Percentages are rounded to the nearest one decimal point.
E use with caution.
3.7.2. Low income status
Figure 20. Low income status (after tax) of adults aged 15 and older by disability status, Ontario, 2010
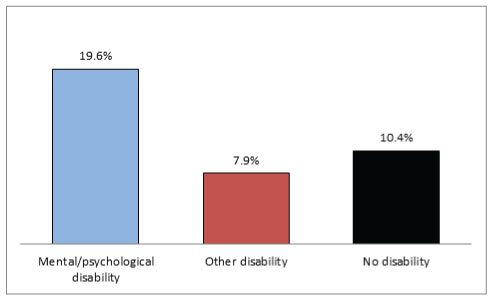
Source: Adapted from Statistics Canada, Custom Tabulation, Canadian Survey on Disability, 2012.
Percentages are rounded to the nearest one decimal point.
E use with caution
In 2010, the proportion of people with mental health and addiction disabilities in Ontario in low income status [37] was 19.6% compared to 10.4% for people without disabilities. This proportion is more than two times greater than that of people with other disabilities (7.9%).
A slightly lower proportion of people with mental health and addiction disabilities in Ontario were in low income status (19.6%) in 2010 compared to people with mental health and addiction disabilities in Canada (21.5%).
Table 28. Low income status (after tax) of adults aged 15 and over by disability status, Ontario and Canada, 2010
|
|
Ontario |
Canada |
||
|
|
|
|||
|
Disability staus |
Number |
% |
Number |
% |
|
Mental/psychological disability |
99,950
|
19.6
|
227,850
|
21.5
|
|
Other disability |
89,830
|
7.9
|
257,750
|
9.5
|
|
No disability |
941,960
|
10.4
|
2,447,600
|
10.3
|
Source: Adapted from Statistics Canada, Custom Tabulation, Canadian Survey on Disability, 2012.
Percentages are rounded to the nearest one decimal point.
E use with caution.
[16] Statistics Canada, Canadian Survey on Disability, 2012: Concepts and Methods Guide, supra note 6 at 9; Human Resources and Skills Development Canada, Federal Disability Report: The Government of Canada’s Annual Report on Disability Issues, (Gatineau, Quebec: Her Majesty the Queen in Right of Canada, 2010) online: Government of Canada www.esdc.gc.ca/eng/disability/arc/federal_report2010/fdr_2010.pdf (retrieved July 9, 2015) .
[17] Statistics Canada, Canadian Survey on Disability, 2012: Concepts and Methods Guide, supra note 6 at 9.
[18] Includes First Nations peoples, Métis peoples and the Inuit. See the glossary for more information.
[19] Race is a “social construct.” The Report of the Commission on Systemic Racism in the Ontario Criminal Justice System defined racialization as “the process by which societies construct races as real, different and unequal in ways that matter to economic, political and social life.” Commission on Systemic Racism in the Ontario Criminal Justice System, Report of the Commission on Systemic Racism in the Ontario Criminal Justice System (Toronto: Queen’s Printer for Ontario, 1995) (Co-Chairs: D. Cole & M. Gittens) at 40-41. For more information, see Ontario Human Rights Commission, Policy and guidelines on racism and racial discrimination (Toronto: Queen’s Printer for Ontario, 2005), online: OHRC www.ohrc.on.ca/en/policy-and-guidelines-racism-and-racial-discrimination.
[20] See the definition of “racialized people” in the glossary for more information.
[21] This is called a “census family.” See the glossary for the definition.
[22] Jacqueline Luffman, “Measuring Housing Affordability” (2006) 7(11) November. Perspectives on Labour and Income, Statistics Canada Catalogue no. 75-001-XIE. Online: Statistics Canada www.statcan.gc.ca/pub/75-001-x/75-001-x2006111-eng.htm (retrieved April 22, 2015) at 16.
[23] In the PALS, this group was defined as people with “emotional disabilities.”
[24] “Other dwellings” include other single attached houses (e.g. a single dwelling attached to a non-residential structure such as a store or church, or to another residential structure such as an apartment building), mobile homes, and other moveable dwellings (such as houseboats or recreational vehicles). Adapted from Statistics Canada, National Household Survey Dictionary, 2011 (2013) Statistics Catalogue no. 99-000-X2011001. Online: Statistics Canada www12.statcan.gc.ca/nhs-enm/2011/ref/dict/99-000-x2011001-eng.pdf (retrieved April 22, 2015) at 183.
[25] Employment and Social Development Canada, no date. Canadian Occupational Projection System (COPS): Graph Descriptions of Imbalances. Last updated October 18, 2012. Online: Employment and Social Development Canada http://occupations.esdc.gc.ca/sppc-cops/c.4nt.2nt@-eng.jsp?cid=37 (retrieved August 31, 2015).
[26] The “labour force” is made up of people who are employed and people who are unemployed; "unemployed" refers to people who are without work, but are available for work and are actively seeking work. People may be out of the labour force because their disability or workplace barriers prevent them from working or seeking work. They may be occupied with caregiving or other responsibilities, retired, not be looking for work, or attending school full or part-time. See the glossary for more information.
[27] The employment rate is calculated by dividing the number of people employed by the total population (aged 15-64). See the definition of “employed” in the glossary for more information.
[28] The unemployment rate is calculated by dividing the number of people who are unemployed (people looking for work) by the population in the labour force (people employed and people unemployed). See the definition of “unemployed” in the glossary for more information.
[29] These experiences are echoed by other research. For example, in one study that surveyed over 2,000 working Ontarians aged 18 and over, over one-third of respondents said that they would not tell their current manager if they had a mental health problem. Among the reasons for not disclosing were fear that it would affect their careers, fear of losing friends, and the bad experiences of others. CS Dewa, “Worker attitudes towards mental health problems and disclosure” (2014) 5 International J ournal of Occupational and Environmental Medicine Vol.5 No.4.
[30]The accommodation required could relate to a mental health or addiction disability or, where people reported multiple disability types, it could relate to another disability.
[31] The median income is the mid-point where, by definition, half of the population is above the median line and half falls below. The median income measure was chosen over the commonly used average/mean income, in part because median income provides better information about the distribution of income in the population.
[32] Total personal income is income from all sources, including self-employment income, wages and salaries, government income, retirement income, investments and no income. Because employment income tends to be higher than income from other sources (such as government or retirement income), the median total personal employment income figure is higher than the median total personal income.
[33] Income figures represent income before tax.
[34] The total household income is the sum of the total incomes of all members of that household. See the glossary for more information.
[35] Government income includes Canada Pension Plan benefits, Employment Insurance benefits, child benefits, Guaranteed Income Supplement, and other income from government sources. It could also include income from social assistance.
[36] See the glossary for a detailed definition of “personal employment income.”
[37]Statistics Canada used the Low-Income Cut Off (after tax) to calculate these figures (LICO-AT). Although Canada has no official “poverty line,” LICOs are one measure of low income. According to Statistics Canada, “a LICO is an income threshold below which a family will likely devote a larger share of its income on the necessities of food, shelter and clothing than the average family. The approach is essentially to estimate an income threshold at which families are expected to spend 20 percentage points more than the average family on food, shelter and clothing.” In, Statistics Canada, 2009, Low income cut-offs for 2008 and low income measures for 2007. Statistics Canada Catalogue no. 75F0002M – No. 002. Ottawa, Ontario. Income Research Paper Series. Online: Statistics Canada www.statcan.gc.ca/pub/75f0002m/75f0002m2009002-eng.pdf (retrieved May 25, 2015) at 7. Therefore, if the average family of four in a medium-sized city spent 43% of their after-tax income on food, clothing and shelter in 1992, families with incomes below the LICO-AT are spending more than 63% of their after-tax income on these necessities. LICO-ATs for family units in Canadian communities can be found at Statistics Canada, no date. Table 1 Low income cut-offs (1992 base) after tax (table). Statistics Canada Catalogue. Ottawa, Ontario. Last updated June 27, 2013. Online: Statistics Canada www.statcan.gc.ca/pub/75f0002m/2013002/tbl/tbl01-eng.htm (retrieved May 26, 2014). LICOs differ depending on the size of the community and the size of the family unit. For example, in a Census Metropolitan Area of 500,000 inhabitants or more, the 2012 LICO-AT for one person was $19,597. LICOs are limited in that they are still based on 1992 figures of family consumption patterns and are only adjusted for inflation. They also do not apply to peoples living on First Nations reserves or economic families or unattached individuals in the Yukon and the Northwest Territories. See Statistics Canada, Low Income Lines, 2011-2012. Statistics Canada Catalogue no. 75F0002M – No. 002, Ottawa: Ontario. Income Research Paper Series. 75F0002M. 2013. Online: Statistics Canada www.statcan.gc.ca/pub/75f0002m/75f0002m2013002-eng.htm (retrieved August 20, 2015); Brian Murphy, Xuelin Zhang & Claude Dionne, 2012, Low Income in Canada: a Multi-line and Multi-index Perspective. Statistics Canada Catalogue no. 75F0002M – No. 001. Ottawa, Ontario. 112 p. Income Research Paper Series. Online: Statistics Canada www.statcan.gc.ca/pub/75f0002m/75f0002m2012001-eng.pdf (retrieved May 26, 2015), at 38; Statistics Canada, Special tabulation, based on Canadian Survey on Disability, 2012.
4. Discussion
Ontarians with disabilities, especially people with mental health and addiction disabilities, continue to face disparities on several social and economic indicators compared to people without disabilities. They have a higher unemployment rate, are more likely to be in low income status, have lower educational levels and are less likely to live in adequate, affordable housing.
When controlling by disability type, the results show that people with mental health and addiction disabilities fare worse on most indicators than people with other types of disabilities. However, it is important to consider the complex relationship between these two groups. As the data show, the vast majority of people who report mental health and addiction disabilities (over 90%) also report another disability type. Having a chronic physical condition can be a risk factor for developing a mental health disability and vice versa.[38]
It may be that having a mental health disability or addiction is related to low income, high unemployment, and low education, etc., compared to people with other disabilities or no disability.[39] Alternatively, it could be that the combined effect of multiple disabilities is associated with these factors. Having multiple disabilities may contribute to greater severity of disability overall and barriers in society may be compounded, leading to increased exclusion and discrimination.[40]
However, the relationship between disability and social and economic indicators can be complex. Is it that having a disability contributes to higher unemployment, lower education levels, and low income? Or does having low income, low education levels, poor housing and poor employment opportunities contribute to greater prevalence of disability, including mental health and addiction disabilities? Research indicates that both considerations are important.[41]
With respect to sample size, because of the relatively small data set in Ontario, the results could not be broken down by sex, age and severity of disability. Age, in particular, is a potential confounding factor. The OHRC could not examine, for example, the prevalence of mental health and addiction disabilities among Indigenous peoples, racialized people and women, distributed across age groups, in comparison with people with other disabilities and people with no disabilities. In a further example, it is not clear whether women in Ontario are more likely than men to report other disabilities because they tend to live longer. Similarly, does the reporting of mental health and addiction disabilities for racialized people differ by age?
[38] Government of Canada, The Human Face of Mental Health and Mental Illness in Canada (Ottawa: Minister of Public Works and Government Services Canada, 2006) at 16; Canadian Mental Health Association, The Relationship between Mental Health, Mental Illness and Chronic Physical Conditions (2008), http://ontario.cmha.ca/public_policy/the-relationship-between-mental-health-mental-illness-and-chronic-physical-conditions/#.VWNyW9LBzGc (retrieved May 25, 2015). See also Oye Gureje et al., “Persistent Pain and Well-Being: A World Health Organization Study in Primary Care” (1998) 280(2) JAMA 147.
[39] For more information on how mental health is associated with various social and economic outcomes see Canadian Institute for Health Information, Reducing Gaps in Health: A Focus on Socio-Economic Status in Urban Canada (Ottawa, Ont.: Canadian Institute for Health Information, 2008); Carolyn S. Dewa & David McDaid, “Investing in the Mental Health of the Labor Force: Epidemiological and Economic Impact of Mental Health Disabilities in the Workplace,” in Izabela Z. Schultz & E. Sally Rogers, eds., Work Accommodation and Retention in Mental Health (New York: Springer, 2011); Canadian Institute for Health Information, Improving the Health of Canadians: Mental Health and Homelessness (Ottawa: CIHI, 2007); Interim Report of the Standing Senate Committee on Social Affairs, Science and Technology, Report 1: Mental Health, Mental Illness and Addiction: Overview of Policies and Programs in Canada (2004) (Chair: Michael J.L. Kirby) at 50; Government of Canada, The Human Face of Mental Health and Mental Illness in Canada (Ottawa: Minister of Public Works and Government Services Canada, 2006).
[40] See the calculation of Statistics Canada’s global severity score, supra note 6 at 9. For a review of the impact of severe disabilities on education, employment and other variables, see Human Resources and Skills Development Canada, supra note 16 and Derek Hum & Wayne Simpson, “Canadians with
Disabilities and the Labour Market” (1996) 22(3) Canadian Public Policy 285. See also section 9.1. of the OHRC’s Minds that Matter report, supra note 1, “Intersections with other types of disabilities” at 30.
[41] Research on the social determinants of health shows that many factors, including unemployment, discrimination, poor housing, and poverty can contribute to poor physical and mental health. See Juha Mikkonen & Dennis Raphael, Social Determinants of Health: The Canadian Facts (Toronto: York University School of Health Policy and Management, 2010) Online: www.thecanadianfacts.org/ (retrieved May 27, 2015) and Beth Wilson, Sick and Tired: The Compromised Health of Social Assistance Recipients and the Working Poor in Ontario (Toronto: The Wellesley Institute, 2009) Online: The Wellesley Institute www.wellesleyinstitute.com/wp-content/uploads/2011/11/sickandtiredfinal.pdf (retrieved May 27, 2015).
Areas for further research
More information on the lives of people with mental health and addiction disabilities could be collected on other variables. For example, contact with the criminal justice system is an important indicator of marginalization and social exclusion.[42] Similarly, knowing what proportion of this group live in collective dwellings (such as hospitals, group homes and lodging houses) or are homeless across Ontario would provide a better understanding of their housing needs.
Also, without data on Indigenous peoples who live on reserves, a complete picture cannot be created of the lives of Indigenous peoples with mental health, addiction and other disabilities.
The results on low income merit more specific research to better understand the relationship between mental health and low income. People with disabilities overall are more likely to be in low income status than people without disabilities, due to their lower labour force participation.[43] However, when controlling for disability type, mental health and addiction disabilities appear to be highly correlated with being in low income and other disabilities less so. In fact, the results show that a lower proportion of people with other disabilities are in low income status than people without disabilities. This trend has been noted in other Statistics Canada data[44] but requires further examination.
The finding that racialized people in Ontario report lower prevalence of mental health and addiction disabilities compared to non-racialized people and Indigenous peoples needs further examination. It appears to contrast with research that finds that structural barriers such as poverty, low-socioeconomic status, inadequate and unaffordable housing, unemployment and underemployment disproportionately affect racialized people. These factors also negatively affect mental health.[45] Several studies have also found that self-reported racism is associated with negative mental health outcomes.[46]
Another area of research involves further data collection to monitor discrimination, including people’s perceptions of discrimination in Code-protected social areas such as housing and services. Additional questions could be asked about the types of discrimination people experience, factors that can protect people against discrimination, and how people access justice. For example, how commonly do people with mental health disabilities and addictions experience harassment? Are there intersections between discrimination based on a person’s disability and another Code-related identity, such as race or sex? What factors make it easier to disclose a disability and request accommodation? How do people typically seek redress (if at all) when they have been discriminated against?
Note that documenting people’s perceptions of discrimination is limited in that it cannot lead to conclusions about actual incidence rates of discrimination. Measuring discrimination is very difficult, as it can be explained by multiple factors. Studies that may be able to better monitor discrimination use methods that look at people’s behaviour in real-life or constructed situations to assess whether groups are treated differently based on Code grounds.[47]
Overall, the findings in this report have implications for policy and research involving Ontarians with mental health, addiction and other disabilities. They provide support for further research on disparities and solutions. They also provide a supportive rationale for organizations to put in place methods to prevent and respond to systemic discrimination. These methods include reviewing and removing barriers, incorporating inclusive design approaches, developing human rights policies and designing special programs (such as hiring and housing programs) that respond to the unique needs of people with mental health, addiction and other disabilities.
[42]The Canadian Community Health Survey – Mental Health, 2012, has collected data on contact with police, such as arrests, but not criminal convictions or incarceration. Statistics Canada, 2011, Canadian Community Health Survey (CCHS) – Mental Health Questionnaire. Online: Statistics Canada www23.statcan.gc.ca/imdb/p3Instr.pl?Function=getInstrumentList&Item_Id=119788&UL=1V& (retrieved May 27, 2015) at 178. See also Maire Sinha, An Investigation into the Feasibility of Collecting Data on the Involvement of Adults and Youth with Mental Health Issues in the Criminal Justice System. Statistics Canada Catalogue no. 85-561-M — No. 016. Ottawa: Ontario. Crime and Justice Research Paper Series, 85-561-M, Vol. 2009 no. 16. Online: Statistics Canada www.statcan.gc.ca/pub/85-561-m/85-561-m2009016-eng.pdf (retrieved May 27, 2015).
[43] See Diane Galarneau & Marian Radulescu, “Employment among the Disabled” (2009) 10(5) Perspectives on Labour and Income. Statistics Canada Catalogue no. 75-001-X. Online: Statistics Canada www.statcan.gc.ca/pub/75-001-x/2009105/article/10865-eng.htm (retrieved April 2, 2015).
[44] Statistics Canada data from the 2006 Participation and Activity Limitation Survey (PALS) custom tabulated for the OHRC show that 27% of people in Ontario with “emotional” disabilities” live in low income status compared to people with other types of disabilities (10%) and people who did not report having disabilities (11%). Statistics Canada. 2012. Special tabulation, based on Participation and Activity Limitation Survey, 2006.
[45] For a review of the literature on the effect of societal barriers on the physical and mental health of racialized people, see Access Alliance Multicultural Community Health Centre, Racialised Groups and Health Status: A Literature Review Exploring Poverty, Housing, Race-Based Discrimination and Access to Health Care as Determinants of Health for Racialised Groups (Toronto: Access Alliance Multicultural Community Health Centre, 2005) online: Access Alliance Multicultural Community Health Centre http://accessalliance.ca/community-based-research/publications/ (retrieved July 8, 2015). See also Sheryl Nestel, Colour Coded Health Care The Impact of Race and Racism on Canadians’ Health (Toronto: Wellesley Institute, 2012), online: Wellesley Institute http://www.wellesleyinstitute.com/tag/race-racism/page/2/ (retrieved July 8, 2015) at 14; and Kwasi Kafele, Racial discrimination and mental health in racialized and Aboriginal communities (2005), online: Ontario Human Rights Commission http://www.ohrc.on.ca/en/race-policy-dialogue-papers/racial-discrimination-and-mental-health-racialized-and-aboriginal-communities (retrieved July 8, 2015).
[46] Yin Paradies, “A systematic review of empirical research on self-reported racism and health” (2006) 35 Int J Epidemiology 888.
[47] One example of such a study is by the Centre for Equality Rights in Accommodation. It looked at how subtle and direct discrimination play out in the Toronto housing market. Volunteers did a telephone audit to apply for real rental vacancies. They used a series of scripts based on “profiles” that paired all characteristics except for the one that might lead to discrimination. For the mental disability profile, volunteers pretended they were from a mental health agency trying to find housing for their clients. Overall, the study showed that more than one-third of housing seekers with mental disabilities were discriminated against in the Toronto housing market. See Sorry It’s Rented: Measuring Discrimination in Toronto’s Rental Housing Market (2009) online: www.equalityrights.org/cera/?page_id=179 (retrieved April 6, 2015). Another example involves the statistical analysis of data that record the actions of individuals (such as data on traffic stops), to see if there are disproportionate impacts on groups based on Code grounds.
Appendix A: Glossary of terms
Census family: A married couple and the children, if any, of either or both spouses; a couple living common-law and the children, if any, of either or both partners; or, a lone parent of any marital status with at least one child living in the same dwelling and the child or children. All members of a particular census family live in the same dwelling. A couple may be of opposite or same sex. Children may be children by birth, marriage or adoption regardless of their age or marital status as long as they live in the dwelling and do not have their own spouse or child living in the dwelling. Grandchildren living with their grandparent(s) but with no parents present also constitute a census family.[48]
Collective dwelling: A dwelling of a commercial, institutional or communal nature. It may be identified by a sign on the premises or by an enumerator speaking with the person in charge, a resident, a neighbour, etc. Included are lodging or rooming houses, hotels, motels, tourist homes, nursing homes, residences for senior citizens, hospitals, staff residences, communal quarters (military bases), work camps, jails, group homes for people with psychiatric or developmental disabilities, and so on. Collective dwellings may be occupied by usual residents or solely by foreign residents and/or by temporarily present persons.[49]
Private dwelling: A separate set of living quarters in which a person or a group of persons live permanently.[50]
Core housing need: The Canada Mortgage and Housing Corporation (CMHC) uses the concept of “core housing need” which includes:
- Adequacy: The physical condition of the dwelling (e.g. whether housing is in need of major repairs)
- Suitability: whether the housing is of a suitable size and has enough bedrooms for the size and make-up of the household
- Affordability: whether it costs less than 30% of before-tax household income.
The CMHC states, “A household is said to be in core housing need if its housing fails to meet one of these standards and if it is unable to pay the median rent for alternative local housing meeting all standards without spending 30% or more of its before-tax income.”[51]
Economic family: A group of two or more persons who live in the same dwelling and are related to each other by blood, marriage, common-law, adoption or a foster relationship.[52]
Household: A person or a group of persons (other than foreign residents) who occupy the same private dwelling and do not have a usual place of residence elsewhere in Canada. Household members who are temporarily absent on the day of the survey (e.g. temporarily residing elsewhere) are considered as part of their usual household. Every person is a member of one and only one household.[53]
Labour force: The number of employed people plus the number of unemployed people.[54]
Employed: People who, during the reference week of 2011:
(a) Did any work at all at a job or business, that is, paid work in the context of an employer-employee relationship, or self-employment. It also includes people who did unpaid family work, which is defined as unpaid work contributing directly to the operation of a farm, business or professional practice owned and operated by a related member of the same household;
(b) Had a job but were not at work due to factors such as their own illness or disability, personal or family responsibilities, vacation or a labour dispute. This category excludes people not at work because they were on layoff or between casual jobs, and those who did not then have a job (even if they had a job to start at a future date).[55]
Unemployed: People who, during the reference week in 2011, were without paid work or without self-employment work and were available for work and either:
(a) Had actively looked for paid work in the past four weeks; or
(b) Were on temporary layoff and expected to return to their job; or
(c) Had definite arrangements to start a new job in four weeks or less.[56]
Not in the labour force: The number of people who were neither employed nor unemployed. This includes people who were unwilling or unable to offer or supply labour services under conditions existing in their labour markets (including people who were full-time students currently attending school).[57]
Single (never legally married): A person who has never married or a person whose marriage has been annulled and who has not remarried. People living common-law are not included in this category.[58]
Common-law: A person who is living with another person as a couple but who is not legally married to that person.[59]
Married (and not separated): A person who is married and has neither separated nor divorced, and whose spouse is living. Persons living common-law are not included in this category.[60]
Separated: A person who is married but who is no longer living with his/her spouse (for any reason other than illness, work or school) and who has not obtained a divorce.[61]
Divorced: A person who has obtained a legal divorce and who has not remarried.[62]
Widowed: A person who has lost his/her spouse through death and who has not remarried.[63]
Low income cut-offs after tax (LICO-AT): LICOs are based on family expenditure data. Below the LICO, families will spend a larger share of income for food, shelter and clothing than the average family. LICOs change over time depending on the size of the community and the family.
Personal employment income: Total income from wages and salaries (before deductions), net income from unincorporated non-farm business and/or professional practice and net farm self-employment income for someone over the age of 15 during 2010.
Total income: Total income from all sources, including employment income, income from government programs, pension income, investment income and any other money income for people over age 15 during 2010.[64]
Government transfer payments (government income): All cash benefits received from federal, provincial, territorial or municipal governments during 2010, including the Old Age Security pension and Guaranteed Income Supplement, Allowance for the Survivor, benefits from Canada Pension Plan or Quebec Pension Plan, benefits from Employment Insurance, child benefits and other income from government sources.[65]
Household Income: Income for persons aged 15 and over living in the household, from all sources.
Discrimination: Statistics Canada and the Ontario Human Rights Code do not define discrimination. Instead, its understanding has evolved from human rights tribunal and court decisions. It can be characterized as negative treatment or impact, intentional or not, based on a Code ground [age, ancestry, colour, race, citizenship, ethnic origin, place of origin, creed, disability, family status, marital status, gender identity, gender expression, receipt of public assistance (in housing only), record of offences (in employment only), sex, sexual orientation] in a protected social area: housing, contracts, employment, goods, services and facilities and membership in unions, trade or professional associations.
Discrimination includes any distinction, including any exclusion, restriction or preference based on a Code ground that impairs the recognition of human rights and fundamental freedoms.[66] For a more detailed description, see section 9 of the OHRC’s Policy on preventing discrimination based on mental health disabilities and addictions, at www.ohrc.on.ca.
Indigenous peoples: The OHRC uses the term “Indigenous peoples,” which is based on the Statistics Canada term “Aboriginal identity.” “Aboriginal identity” refers to whether the person reported being an Aboriginal person, that is, First Nations (North American Indian), Métis or Inuk (Inuit) and/or being a Registered or Treaty Indian (registered under the Indian Act of Canada) and/or being a member of a First Nation or Indian band.[67]
Racialized people: In this report, this term refers to the Statistics Canada term “visible minority.” The federal Employment Equity Act defines visible minorities as “persons, other than Aboriginal peoples, who are non-Caucasian in race or non-white in colour.” Categories in the visible minority variable include South Asian, Chinese, Black, Filipino, Latin American, Arab, Southeast Asian, West Asian, Korean, Japanese, Visible minority, n.i.e. (“not included elsewhere”) and multiple visible minorities.[68]
However, race is socially constructed. The Report of the Commission on Systemic Racism in the Ontario Criminal Justice System defined “racialization” as “the process by which societies construct races as real, different and unequal in ways that matter to economic, political and social life.”[69]
Non-racialized people: In this report, non-racialized people are people who do not identify as Indigenous peoples (see the definition above), or as racialized people (“visible minorities” – see the definition above).
[48] Adapted from Statistics Canada, no date. Census Family. Last modified August 13, 2013. Online: Statistics Canada www.statcan.gc.ca/concepts/definitions/c-r-fam-eng.htm (retrieved May 5, 2014).
[49] Adapted from Statistics Canada, Census Dictionary: Census Year 2011 (2012) Statistics Canada Catalogue no. 98-301-X2011001. Online: Statistics Canada www12.statcan.gc.ca/census-recensement/2011/ref/dict/98-301-X2011001-eng.pdf (retrieved April 22, 2015) at 55-57.
[50] Statistics Canada, National Household Survey Dictionary, 2011 (2013) Statistics Catalogue no. 99-000-X2011001. Online: Statistics Canada www12.statcan.gc.ca/nhs-enm/2011/ref/dict/99-000-x2011001-eng.pdf (retrieved April 22, 2015) at 174.
[51] Jacqueline Luffman, supra note 22 at 16.
[52] Statistics Canada, National Household Survey Dictionary, 2011, supra note 50 at 174.
[53] Adapted from Statistics Canada, National Household Survey Dictionary, 2011, supra note 50 at 179.
[54] Adapted from Statistics Canada, National Household Survey Dictionary, 2011, supra note 50 at 71.
[55] Adapted from Statistics Canada, National Household Survey Dictionary, 2011, supra note 50 at 55.
[56] Adapted from Statistics Canada, National Household Survey Dictionary, 2011, supra note 50 at 88.
[57] Statistics Canada, no date. Labour Force. Last updated December 1, 2008. Online: Statistics Canada www.statcan.gc.ca/pub/81-004-x/def/4153361-eng.htm (retrieved April 22, 2015).
[58] Statistics Canada, National Household Survey Dictionary, 2011, supra note 50 at 180.
[59] Ibid.
[60] Ibid.
[61] Ibid.
[62] Ibid.
[63] Ibid.
[64] Adapted from Statistics Canada, National Household Survey Dictionary, 2011, supra note 50 at 153.
[65] Adapted from Statistics Canada, National Household Survey Dictionary, 2011, supra note 50 at 129-130.
[66] The Supreme Court of Canada has described discrimination in the context of equality claims under s. 15 of the Canadian Charter of Rights and Freedoms as a distinction based on a prohibited ground that has the “effect of imposing burdens, obligations, or disadvantages on such individual or group not imposed upon others, or which withholds or limits access to opportunities, benefits, and advantages available to other members of society;” Andrews v. Law Society of British Columbia, [1989] 1 S.C.R. 143 at 174.
[67] Statistics Canada, no date. Aboriginal Peoples Reference Guide, National Household Survey, 2011, Statistics Canada Catalogue no. 99-011-XWE2011006. Last updated May 28, 2014. Online: Statistics Canada www12.statcan.gc.ca/nhs-enm/2011/ref/guides/99-011-x/99-011-x2011006-eng.cfm (retrieved April 22, 2015).
[68] Adapted from Statistics Canada, Visible Minority and Population Group Reference Guide: National Household Survey, 2011 (2013) Statistics Canada Catalogue no. 99-010-X2011009. Online: Statistics Canada www12.statcan.gc.ca/nhs-enm/2011/ref/guides/99-010-x/99-010-x2011009-eng.pdf (retrieved April 22, 2015) at 4.
[69] Commission on Systemic Racism in the Ontario Criminal Justice System, supra note 19.