Page controls
Page content
1. Major religious denominations, Ontario, 19911 and 2001
|
Major Religious Denominations, Ontario 1991 and 2001 |
2001 |
1991 |
Percentage change 1991-2001 |
||
|
Number |
Percent |
Number |
Percent |
||
|
Roman Catholic |
3,866,350 |
34.3 |
3,506,820 |
35.1 |
10.3 |
|
Protestant |
3,935,745 |
34.9 |
4,291,785 |
43.0 |
-8.3 |
|
Christian Orthodox |
264,055 |
2.3 |
187,905 |
1.9 |
40.5 |
|
Christian, not included elsewhere* |
301,935 |
2.7 |
136.515 |
1.4 |
121.2 |
|
Muslim |
352,530 |
3.1 |
145,560 |
1.5 |
142.2 |
|
Jewish |
190,800 |
1.7 |
175,650 |
1.8 |
8.6 |
|
Buddhist |
128,320 |
1.1 |
65,325 |
0.7 |
96.4 |
|
Hindu |
217,560 |
1.9 |
106,705 |
1.1 |
103.9 |
|
Sikh |
104,785 |
0.9 |
50,085 |
0.5 |
109.2 |
|
No religion |
1,809,535 |
16.0 |
1,226,300 |
12.3 |
47.6 |
1 For comparability purposes, 1991 data are presented according to 2001 boundaries.
*Includes persons who report “Christian,” as well as those who report “Apostolic,” “Born-again Christian” and “Evangelical”
Source: Adapted from Statistics Canada, 2003a
2. Major religious denominations, Canada, 1991 and 2001
| 2001 | 1991 | Percentage change 1991-2001 | |||
| Number | % | Number | % | ||
|
Roman Catholic |
12,793,125 |
43.2 |
12,203,625 |
45.2 |
4.8 |
|
Protestant |
8,654,845 |
29.2 |
9,427,675 |
34.9 |
-8.2 |
|
Christian Orthodox |
479,620 |
1.6 |
387,395 |
1.4 |
23.8 |
|
Christian, not included elsewhere** |
780,450 |
2.6 |
353,040 |
1.3 |
121.1 |
|
Muslim |
579,640 |
2.0 |
253,265 |
0.9 |
128.9 |
|
Jewish |
329,995 |
1.1 |
318,185 |
1.2 |
3.7 |
|
Buddhist |
300,345 |
1.0 |
163,415 |
0.6 |
83.8 |
|
Hindu |
297,200 |
1.0 |
157,015 |
0.6 |
89.3 |
|
Sikh |
278,415 |
0.9 |
147,440 |
0.5 |
88.8 |
|
No religion |
4,796,325 |
16.2 |
3,333,245 |
12.3 |
43.9 |
|
*Note: Aboriginal spirituality (+175%), pagan (+281%) and Serbian Orthodox (+109%) communities grew significantly in this period, but the actual number of adherents is not over 30,000 in any of the three categories. |
|||||
|
**Includes persons who report "Christian," "Apostolic," "Born-again Christian" and "Evangelical.” |
|||||
Source: Seljak et al., 2007, p.22. Adapted from a Statistics Canada table available at: www12.statcan.ca/english/census01/Products/Analytic/companion/rel/canada.cfm
3. Environics Institute Focus Canada Survey Findings on specific religious affiliation in Canada in 2011
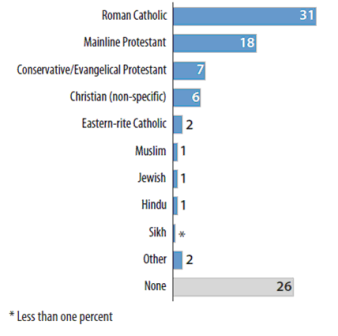
Source: Environics Institute (2011), Focus Canada 2011 Survey, p. 39.
Summary:
A 2011 Focus Canada survey conducted by the Environics Institute reveals that, of Canadians who identify with a specific religious affiliation, 31% identify as Roman Catholic, 18% Mainline Protestant, 7% Conservative/Evangelical Protestant, 6% identify as Christian (non-specific), 2% Eastern-rite Catholic, 1% each Muslim, Jewish, and Hindu respectively. Less than 1% identify as Sikh, and 2% identify as Other. Canadians who do not affiliate with a specific religion total 26%.
4. Percentage change in religious affiliation in Canada 1991 to 2001
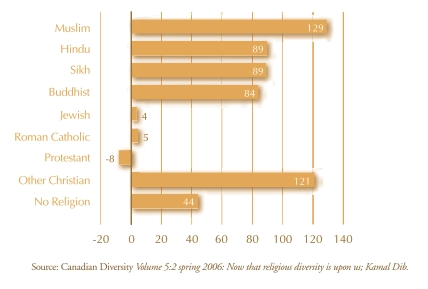
Source: Kunz, 2009. p.8
Summary:
A survey cited in Kunz originally featured in the spring 2006 issue (vol 5:2) of Canadian Diversity reveals the percentage change in religious affiliation from 1991 to 2001. Of the groups surveyed that showed an increase, Muslims increased to 129%, Hindus 89%, Sikhs 89%, Buddhists 84%, Roman Catholics 5%, Jewish 4%, and Other Christian 121%. Canadians affiliated with the Protestant faith showed a decrease of 8%. Canadians who do not identify with a specific religion increased 44% over this period.
5. Canada’s religious composition, 1971-2011 (Pew Research Center)
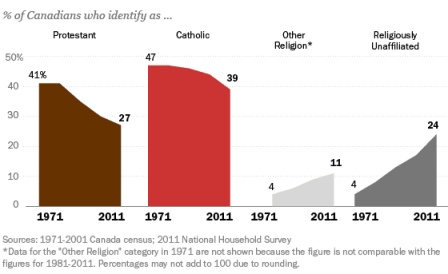
Source: Pew Research Center’s Forum on Religion & Public Life. (2013). Canada’s Changing Religious Landscape: Overview. Accessed July 15, 2013 at www.pewforum.org/Geography/Canadas-Changing-Religious-Landscape.aspx
Note: Unlike in previous decades, when a religion question was included in the census, in 2011 it was part of a voluntary survey among 4.5 million randomly selected households. Roughly 2.65 million households participated in the survey. Statistics Canada has indicated that some groups – immigrants, ethnic minorities, non-English or non-French speakers and Aboriginal Peoples – may be underrepresented among participants in the voluntary survey. Despite these challenges, the 2011 National Household Survey (NHS) represents the best data source for religious affiliation in Canada in 2011 (Pew Forum 2013).
Summary:
In a survey conducted by the Pew Research Centre examining Canada’s religious composition from 1971 to 2011, the percentage of Canadians who identified as Protestant decreased from 41% in 1971 to 27% in 2011. Similarly, people who identified as Catholic decreased from 47% to 39% over the same period. The percentage of Canadians who identified as “Other religion” increased from 4% to 11% from 1971 to 2011, and those who did not identify with any specific religion increased from 4% to 24% over the same period.
6. Growth of religions other than Protestantism and Catholicism in Canada and the U.S. (1981-2011)
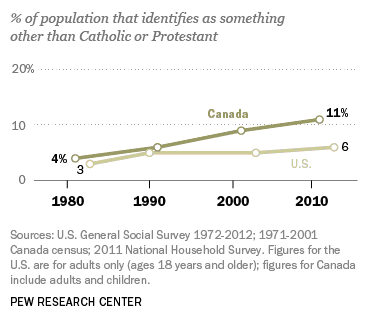
Source: Pew Research Center’s Forum on Religion & Public Life. (2013). Canada’s Changing Religious Landscape: Overview. Accessed July 15, 2013 at www.pewforum.org/Geography/Canadas-Changing-Religious-Landscape.aspx
Note: Unlike in previous decades, when a religion question was included in the census, in 2011 it was part of a voluntary survey among 4.5 million randomly selected households. Roughly 2.65 million households took part in the survey. Statistics Canada has indicated that some groups – immigrants, ethnic minorities, non-English or non-French speakers and Aboriginal Peoples – may be underrepresented among participants in the voluntary survey. Despite these challenges, the 2011 National Household Survey (NHS) represents the best data source for religious affiliation in Canada in 2011 (Pew Forum 2013).
Summary:
In a survey conducted by the Pew Research Centre, from 1980 to 2010, Canadians who identified with a religion other than Protestant or Catholic increased from 4% to 11% during this period. For comparison, in the US, this figure increased from 3% to 6% over the same period.
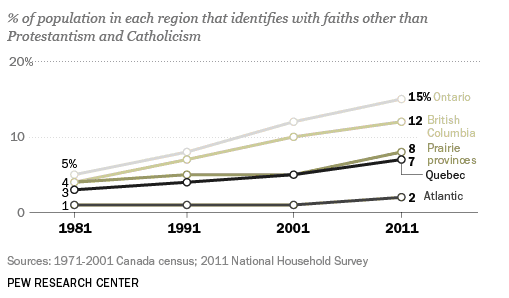
7. Share of Canadians belonging to other religions, by region (1981-2011)
Source: Pew Research Center’s Forum on Religion & Public Life. (2013). Canada’s Changing Religious Landscape: Overview. Accessed July 15, 2013 at www.pewforum.org/Geography/Canadas-Changing-Religious-Landscape.aspx
Note: Unlike in previous decades, when a religion question was included in the census, in 2011 it was part of a voluntary survey among 4.5 million randomly selected households. Roughly 2.65 million households took part in the survey. Statistics Canada has indicated that some groups – immigrants, ethnic minorities, non-English or non-French speakers and Aboriginal Peoples – may be underrepresented among participants in the voluntary survey. Despite these challenges, the 2011 National Household Survey (NHS) represents the best data source for religious affiliation in Canada in 2011 (Pew Forum 2013).
Summary:
In a survey conducted by the Pew Research Centre, the percentage of the population in Canada that identifes with a religion other than Protestantism or Catholicism is displayed by region. Between 1981 and 2011, the Ontario region showed an increase from 5% to 15%, British Columbia from 4% to 12%, the Prairie Provinces from 4% to 8%, Quebec from 3% to 7%, and the Altantic region from 1% to 2%.
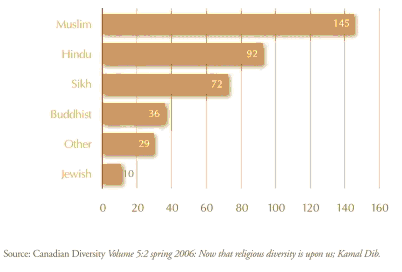
8. Projected percentage change in religious affiliation, 2001 to 2017
Source: Kunz, 2009, p.8
Summary:
A survey cited in Kunz (2009, p.8) originally featured in the spring 2006 issue (vol 5:2) of Canadian Diversity projects the percentage change in the religious affiliation of Canadians between 2001 and 2017. The survey projects that Canadians who identify as Muslim will increase by 145%, Hindu 92%, Sikh 72%, Buddhist 36%, Other 29%, and Jewish 10% over this period.
9. Immigrants by major religious denominations and period of immigration, Canada, before 1961 to 2001
| Period of immigration (%) | |||||
| Before 1961 | 1961- 1970 | 1971-1980 | 1981-1990 | 1991-2001** | |
|
Total immigrants |
100.0 |
100.0 |
100.0 |
100.0 |
100.0 |
|
Roman Catholic |
39.2 |
43.4 |
33.9 |
32.9 |
23.0 |
|
Protestant |
39.2 |
26.9 |
21.0 |
14.5 |
10.7 |
|
Christian Orthodox |
3.8 |
6.3 |
3.8 |
3.0 |
6.3 |
|
Christian, not included elsewhere* |
1.3 |
2.2 |
3.8 |
4.9 |
5.3 |
|
Jewish |
2.7 |
2.0 |
2.2 |
1.9 |
1.2 |
|
Muslim |
0.2 |
1.3 |
5.4 |
7.5 |
15.0 |
|
Hindu |
0.0 |
1.4 |
3.6 |
4.9 |
6.5 |
|
Buddhist |
0.4 |
0.9 |
4.8 |
7.5 |
4.6 |
|
Sikh |
0.1 |
1.1 |
3.9 |
4.3 |
4.7 |
|
No religion |
11.0 |
13.5 |
16.5 |
17.3 |
21.3 |
|
Other religions |
2.1 |
1.0 |
1.1 |
1.3 |
1.4 |
|
* Includes persons who report "Christian," as well as people who report "Apostolic," "Born-again Christian" and "Evangelical.” |
|||||
|
** Includes data up to May 15, 2001. |
|||||
Source: Seljak et al., 2007, p.30. Original Source: Statistics Canada, "Overview: Canada still predominantly Roman Catholic and Protestant," Statistics Canada, www12.statcan.ca/english/census01/Products/Analytic/companion/rel/canada.cfm#growth
10. Religious composition of immigrants in Canada, by decade of arrival (1971-2011)
% of immigrant population that identifies as…
|
|
1971-1980 |
1981-1990 |
1991-2000 |
2001-2010 |
|
Protestant |
24% |
19% |
17% |
17% |
|
Catholic |
32% |
31% |
23% |
22% |
|
Other Religion |
23% |
29% |
38% |
39% |
|
Unaffiliated |
20% |
21% |
23% |
21% |
2011 National Household Survey. Percentages are calculated from unrounded numbers and may not add to 100 due to rounding.
Source: Pew Research Center’s Forum on Religion & Public Life. (2013). Canada’s Changing Religious Landscape: Overview. Accessed July 15, 2013 at www.pewforum.org/Geography/Canadas-Changing-Religious-Landscape.aspx
Note: Unlike in previous decades, when a religion question was included in the census, in 2011 it was part of a voluntary survey among 4.5 million randomly selected households. Roughly 2.65 million households took part in the survey. Statistics Canada has indicated that some groups – immigrants, ethnic minorities, non-English or non-French speakers and Aboriginal Peoples – may be underrepresented among participants in the voluntary survey. Despite these challenges, the 2011 National Household Survey (NHS) represents the best data source for religious affiliation in Canada in 2011 (Pew Forum 2013).